  #组员:倪泽江 彭广威
  import requests
  from functools import partial
  import json
  import os
  import random
  import asyncio
  import pdfplumber
  import numpy as np
  import pandas as pd

  def str2dic(strs):
      a = strs.strip().split('\n')
      m = '{'
      for i in a:
          i = i.strip()
          if ':' in i:
              k = i.split(':')
          else:
              k = i.split(' ')
          k = [i for i in k if i]
          m += "'"+k[0].strip()+"'"+":"+"'"+k[1].strip()+"',"
      m += '}'
      return eval(m)

  lock = asyncio.Lock()
  def get_stock_id():
      path = r"2021年3季度上市公司行业分类结果 .pdf"
      if path not in os.listdir():
          cls = requests.get('http://www.csrc.gov.cn/csrc/c100103/c1558619/1558619/files/1638277734844_11692.pdf').content
          with open(path, 'wb') as fp:
              fp.write(cls)
      pdf = pdfplumber.open(path)
      df = pd.DataFrame(columns=["门类名称及代码", "行业大类代码", "行业大类名称", "上市公司代码", "上市公司简称"])
      for page in pdf.pages[9:12]:
          print(page.extract_text()[:50])
          for table in page.extract_tables():  # 遍历
              df = df.append(pd.DataFrame(table[1:], columns=table[0]), ignore_index=True)
      print(df)
      df_res = df.fillna(method="ffill")  # 空值填充前一个值
      code_21 = df_res.loc[df_res["行业大类代码"] == str(21), ["上市公司代码","上市公司简称"]].values
      code_22 = df_res.loc[df_res["行业大类代码"] == str(22), ["上市公司代码","上市公司简称"]].values
      code = np.vstack((code_21,code_22))
      return code_22

  # data headers url构造
  def get_json(stock_info):
      rand = str(random.random())
      header = str2dic('''Content-Type: application/json
      Host: www.szse.cn
      Origin: https://www.szse.cn
      Referer: https://www.szse.cn/disclosure/listed/fixed/index.html
      User-Agent: Mozilla/5.0 (Windows NT 10.0; Win64; x64) AppleWebKit/537.36 (KHTML, like Gecko) Chrome/101.0.4951.54 Safari/537.36 Edg/101.0.1210.39
      ''')
      daima = [stock[0] for stock in stock_info]
      stockid = str(daima).replace("'", '"')
      i = 1
      data = json.loads('{"seDate":["2012-01-01","2022-5-12"],"stock":'+stockid+
                        ',"channelCode":["fixed_disc"],"bigCategoryId":["010301"],"pageSize":50,"pageNum":'+str(i)+'}')
      url = 'https://www.szse.cn/api/disc/announcement/annList?'+rand

      # request向主页请求,获得筛选数据信息
      loop = asyncio.get_event_loop()
      index = requests.post(url, data=json.dumps(data), headers=header)
      count = index.json()["announceCount"] #通过json该属性得知共有多少条数据,因为只请求了1页(50条),剩余的链接需要再构造
      count = count//50+1 if count%50!=0 else count//50
      data_j = index.json()

      for i in range(2, count+1):
          url = 'https://www.szse.cn/api/disc/announcement/annList?' + rand
          data = json.loads(
              '{"seDate":["2013-01-01","2022-5-12"],"stock":' + stockid +
              ',"channelCode":["fixed_disc"],"bigCategoryId":["010301"],"pageSize":50,"pageNum":' + str(i) + '}')
          # 将得到的后续页数数据插入第一页的数据,方便统一处理
          data_j['data'][-1:-1] = requests.post(url, data=json.dumps(data), headers=header).json()['data']
      return data_j

  # 构造下载链接
  #该方法从json中提取所有年报pdf的链接
  def get_url(data_j):
      down_head = 'https://disc.szse.cn/download'
      reports_url = []
      all_d = data_j['data']
      for report in all_d:
          # 摘要和修改前的年报不提取
          if '取消' in report['title'] or '摘要' in report['title'] or '英文' in report['title']:
              continue
          # 文件名不能出现*号
          reports_url.append((down_head+report['attachPath'], report['title'].replace('*', '')))
      return reports_url


  async def reques_url(url):
      # 年报链接挨个请求,并写入文件
      await lock.acquire()
      if 'report22' not in os.listdir():
          os.mkdir('report22/')
      lock.release()
      path = 'report22/'+url[1]+'.pdf'
      # 判断语句是为了支持断点续传
      if path not in os.listdir('report22/'):
          loop = asyncio.get_event_loop()
          rep = await loop.run_in_executor(None, partial(requests.get,url[0]))
          print(url[1], rep.status_code)
          with open(path, 'wb') as fp:
              print('正在写入')
              fp.write(rep.content)
          print('写入完毕')

  def main():
      stock_info = get_stock_id()
      data_j = get_json(stock_info)
      reports_urls = get_url(data_j)
      tasks = [reques_url(url) for url in reports_urls]
      loop = asyncio.get_event_loop()
      loop.run_until_complete(asyncio.wait(tasks))


  if __name__ == '__main__':
      main()
代码(zuoye.py)
    import fitz
  import pandas as pd
  import os
  import numpy as np
  import pdfplumber
  import re
  from copy import deepcopy
  from Parse_pdf import process_table

  data_model = {
      'web': '',
      'stock_name': '',
      'stock_id': '',
      'address': '',
      'earning': '',
      'eps': '',

  }
  def comp(ar1,ar2):
      boli = []
      count = 0
      for i in range(len(ar1)):
          if ar1[i] == ar2[i]:
              boli.append(False)
              if not ar1[i] and not ar2[i]:
                  continue
              count += 1
          else: boli.append(True)
      if count >= 2:
          return boli
      return False
  def process_table(df):
      df = pd.DataFrame(df)
      df1 = df.ffill()
      df1[df1==""]=np.NAN
      keep = len(df1.columns)-1
      df1 = df1.dropna(thresh=keep-1)
      df1 = df1.fillna('')
      rows = []
      i = 0
      for i in range(1,len(df1.index)):
          last = df1.iloc[i-1, :]
          now = df1.iloc[i,:]
          boli = comp(now[:].values,last[:].values)
          if '基本每股收益' in last[0]:
              flag = 1
              df1.iloc[i - 1, 0] = '基本每股收益(元/股)'
              rows.append(tuple([i for i in df1.iloc[i-1, :]]))
          elif boli:
              for j in range(len(boli)):
                  if boli[j]:
                      leng = -len(df1.iloc[i, j])
                      las = df1.iloc[i-1, j]
                      new = df1.iloc[i, j]
                      if las[leng:] != new:
                          df1.iloc[i,j] = df1.iloc[i-1,j]+df1.iloc[i,j]
                      else: df1.iloc[i, j] = df1.iloc[i-1, j]
          else:
              rows.append(tuple(i for i in last.values))
      rows.append(tuple(i for i in df1.iloc[i,:]))
      return pd.DataFrame(rows)

  def get_page(pdf):
      for i, page in enumerate(pdf.pages):
          text = page.extract_text()
          pat = '公司简介和主要财务指标.*?(\d+)'
          content_text = pdf.pages[i].extract_text()
          pat2 = '公司业务概要.*?(\d+)'
          start = re.compile(pat).findall(content_text)
          end = re.compile(pat2).findall(content_text)
          if not start:
              continue
          pagenum = (int(start[0]), int(end[0])+1)
          return pagenum
  def table_parse(pdf,key):
      s = ''
      if key == 'eps':
          word = '基本每股收益(元/股)'
      elif key == 'earning':
          word = '营业收入'
      elif key == 'stock_name':
          word = '股票简称'
      else:
          return s
      for page in range(3, 15):
          tables = pdf.pages[page].extract_tables()
          for table in tables:
              if table and not s:
                  res = process_table(table)
                  earning = res.loc[res[0] == word, 1]
                  if earning.any():
                      s = earning.values[0].replace('\n', '')
                      print(s)
                      return s
      return s
  def parse_data(pdf):
      data = deepcopy(data_model)
      stock_name = '简称\s*(.*?)\s'
      stock_id = '股票代码\s*(\d{5,6})'
      address = '办公地址\s*(.*?)\s'
      web = '网址\s*(.*?)\s'

      earning = '营业收入(元)\s*(.*?[.]\d{2}).'
      eps = '基本每股收益(元/股)\s*(.*?)\s'

      for page in range(3, 15):
          print(f'正在解析第{page+1}页')
          info_text = pdf.pages[page].extract_text()
          if not (data['web'] and data['stock_name'] and data['stock_id'] and data['address']):
              data['stock_name'] = re.compile(stock_name).findall(info_text)
              data['stock_id'] = re.compile(stock_id).findall(info_text)
              data['address'] = re.compile(address).findall(info_text)
              data['web'] = re.compile(web).findall(info_text)
          if not data['earning']:
              data['earning'] = re.compile(earning).findall(info_text)
          if not data['eps']:
              data['eps'] = re.compile(eps).findall(info_text)
          if data['eps']:
              for key in data.keys():
                  if data[key]:
                      data[key] = data[key][0]
              return data
      for key in data.keys():
          if data[key]:
              data[key] = data[key][0]
      return data

  # path = '上海绿新:2015年年度报告.pdf'
  paths = [i for i in os.listdir() if i[-3:]=='pdf']
  all = []
  for path in paths:
  # try:
      print(f'正在解析:{path}')
      pdf = pdfplumber.open(path)
      # page = get_page(pdf)
      data = parse_data(pdf)
      for key in data.keys():
          if not data[key]:
              data[key]=table_parse(pdf,key)
      if len(data['earning'])<10:
          s1 = table_parse(pdf,'earning')
          if s1:
              data['earning'] = s1
      data['path'] = path
      all.append(data)
  # except Exception as err:
  #     print(path,'wrong',err)
  all1 = [i for i in all if i!=-1]
  all_d = pd.DataFrame(all)
  all_d.to_csv('result.csv')

  结果
晨鸣纸业
2012
2013
2014
2015
2016
2017
2018
2019
2020
2021
revenue
19761679230
20388890067
19101677078
20241906132
22907118242
26274273822
28875756164
30395434073
30736517997
33019812294
eps
0.11
0.35
0.26
0.5
0.99
1.7
0.51
0.33
0.36
0.56
太阳纸业
2012
2013
2014
2015
2016
2017
2018
2019
2020
2021
revenue
10408640842
10895094105
110457882049
10825123853
14455491145
18894287950
21768398462
22762704536
21588648353
31996643206
eps
0.18
0.26
0.2
0.27
0.42
0.8
0.86
0.84
0.75
1.12
裕同科技
2016
2017
2018
2019
2020
2021
revenue
5542362620
6947740684
8578243781
1785109713
11788937056
14850127634
eps
2.43
2.3297
2.364
1.1948
1.2862
1.0869
合兴包装
2012
2013
2014
2015
2016
2017
2018
2019
2020
2021
revenue
2114889587
2442081566
2716474437
2852474015
3542373078
6323377418
12166127616
11096782559
12006566057
17548783681
eps
0.17
0.27
0.36
0.32
0.1
0.15
0.2
0.23
0.24
0.18
中顺洁柔
2012
2013
2014
2015
2016
2017
2018
2019
2020
2021
revenue
2339454973
2501718710
2521780171
2958976614
3809349072
4638349590
5678517623
6634914353
7823528416
9149870465
eps
0.76
0.37
0.17
0.18
0.54
0.47
0.32
0.47
0.7
0.45
景兴纸业
2012
2013
2014
2015
2016
2017
2018
2019
2020
2021
revenue
3104041765
3021515327
2888214411
2954105553
3680969790
5359616136
5938130949
5251104950
4874550664
6224614595
eps
0.01
0.01
0.01
0.01
0.29
0.58
0.3
0.17
0.28
0.38
齐峰新材
2012
2013
2014
2015
2016
2017
2018
2019
2020
2021
revenue
1769999328
2108138188
2537977084
5431806191
2708222182
3573310693
3679092256
3249821175
2810909123
3701956500
eps
0.7
0.45
0.65
0.59
0.29
0.32
0.12
0.27
0.32
0.33
美盈森
2012
2013
2014
2015
2016
2017
2018
2019
2020
2021
revenue
1033500560
1305636965
1563222282
394708216
2219276357
2857419303
3248945549
3392132632
5406831705
3605170216
eps
0.5995
0.4868
0.3657
0.1541
0.1542
0.2258
0.2608
0.3496
0.1267
0.0646
上海绿新
2012
2013
2014
2015
2016
2017
2018
2019
2020
2021
revenue
1371375310
1861958240
1945252087
1855764090
1872486064
1948609493
2054860823
1734366846
1598674369
1550233440
eps
0.48
0.67
-0.07
0.21
0.14
0.15
0.14
-0.1884
0.0074
-0.0267
百亚股份
2020
2021
revenue
1250751478
1463057557
eps
0.46
0.53
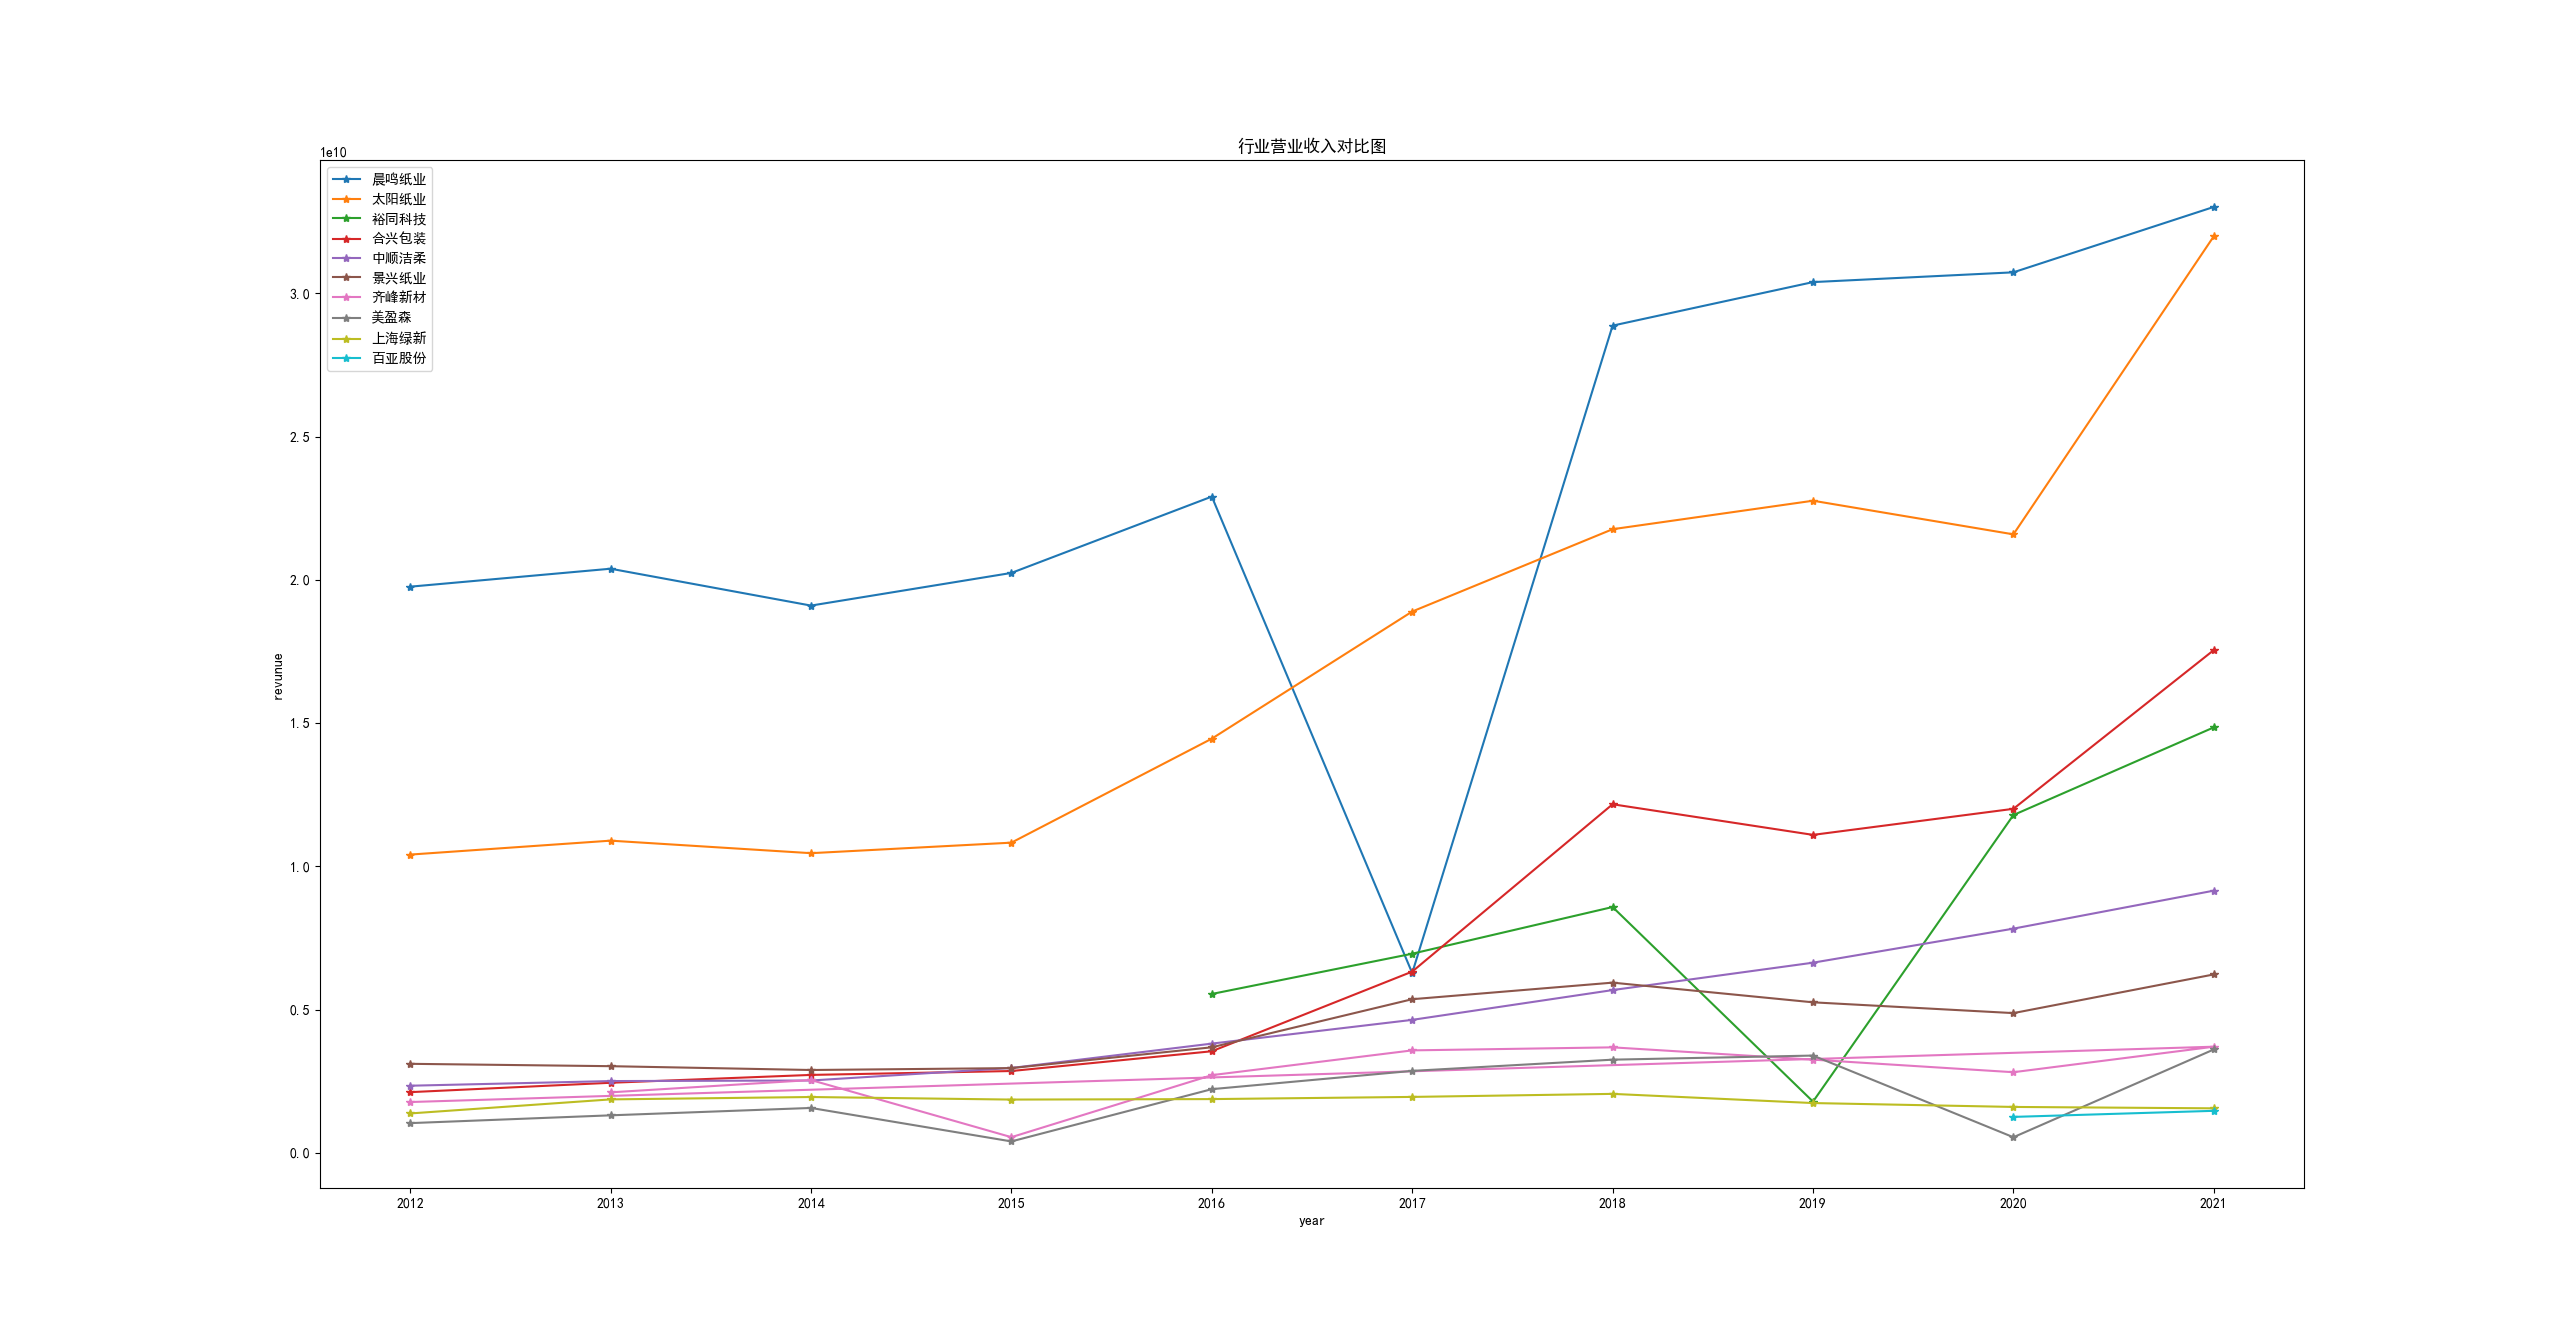
进行画图比较
代码(plot.py)
import pandas as pd
import re
from matplotlib import pyplot as plt
import time
data = pd.read_csv('result.csv',dtype='object',index_col=0)
plt.rcParams["font.sans-serif"]=["SimHei"] #设置字体
plt.rcParams["axes.unicode_minus"]=False #该语句解决图像中的“-”负号的乱码问题
pat = ':(\d{4})'
companies = list(set(data['stock_id']))
df = {}
for stock in companies:
info = data.loc[data.stock_id==stock,:]
year = [re.search(pat,path).group(1) for path in info['path']]
revenue = [float(i.replace(',','')) for i in info['earning']]
eps = [float(i) for i in info.eps]
name = info.iloc[0,1]
df[name] = {
'name':name,
'year':year,
'revenue':revenue,
'eps':eps,
'mean':pd.Series(revenue).mean()
}
top10 = sorted(list(df.items()),key=lambda x:x[1]['mean'],reverse=True)[:10]
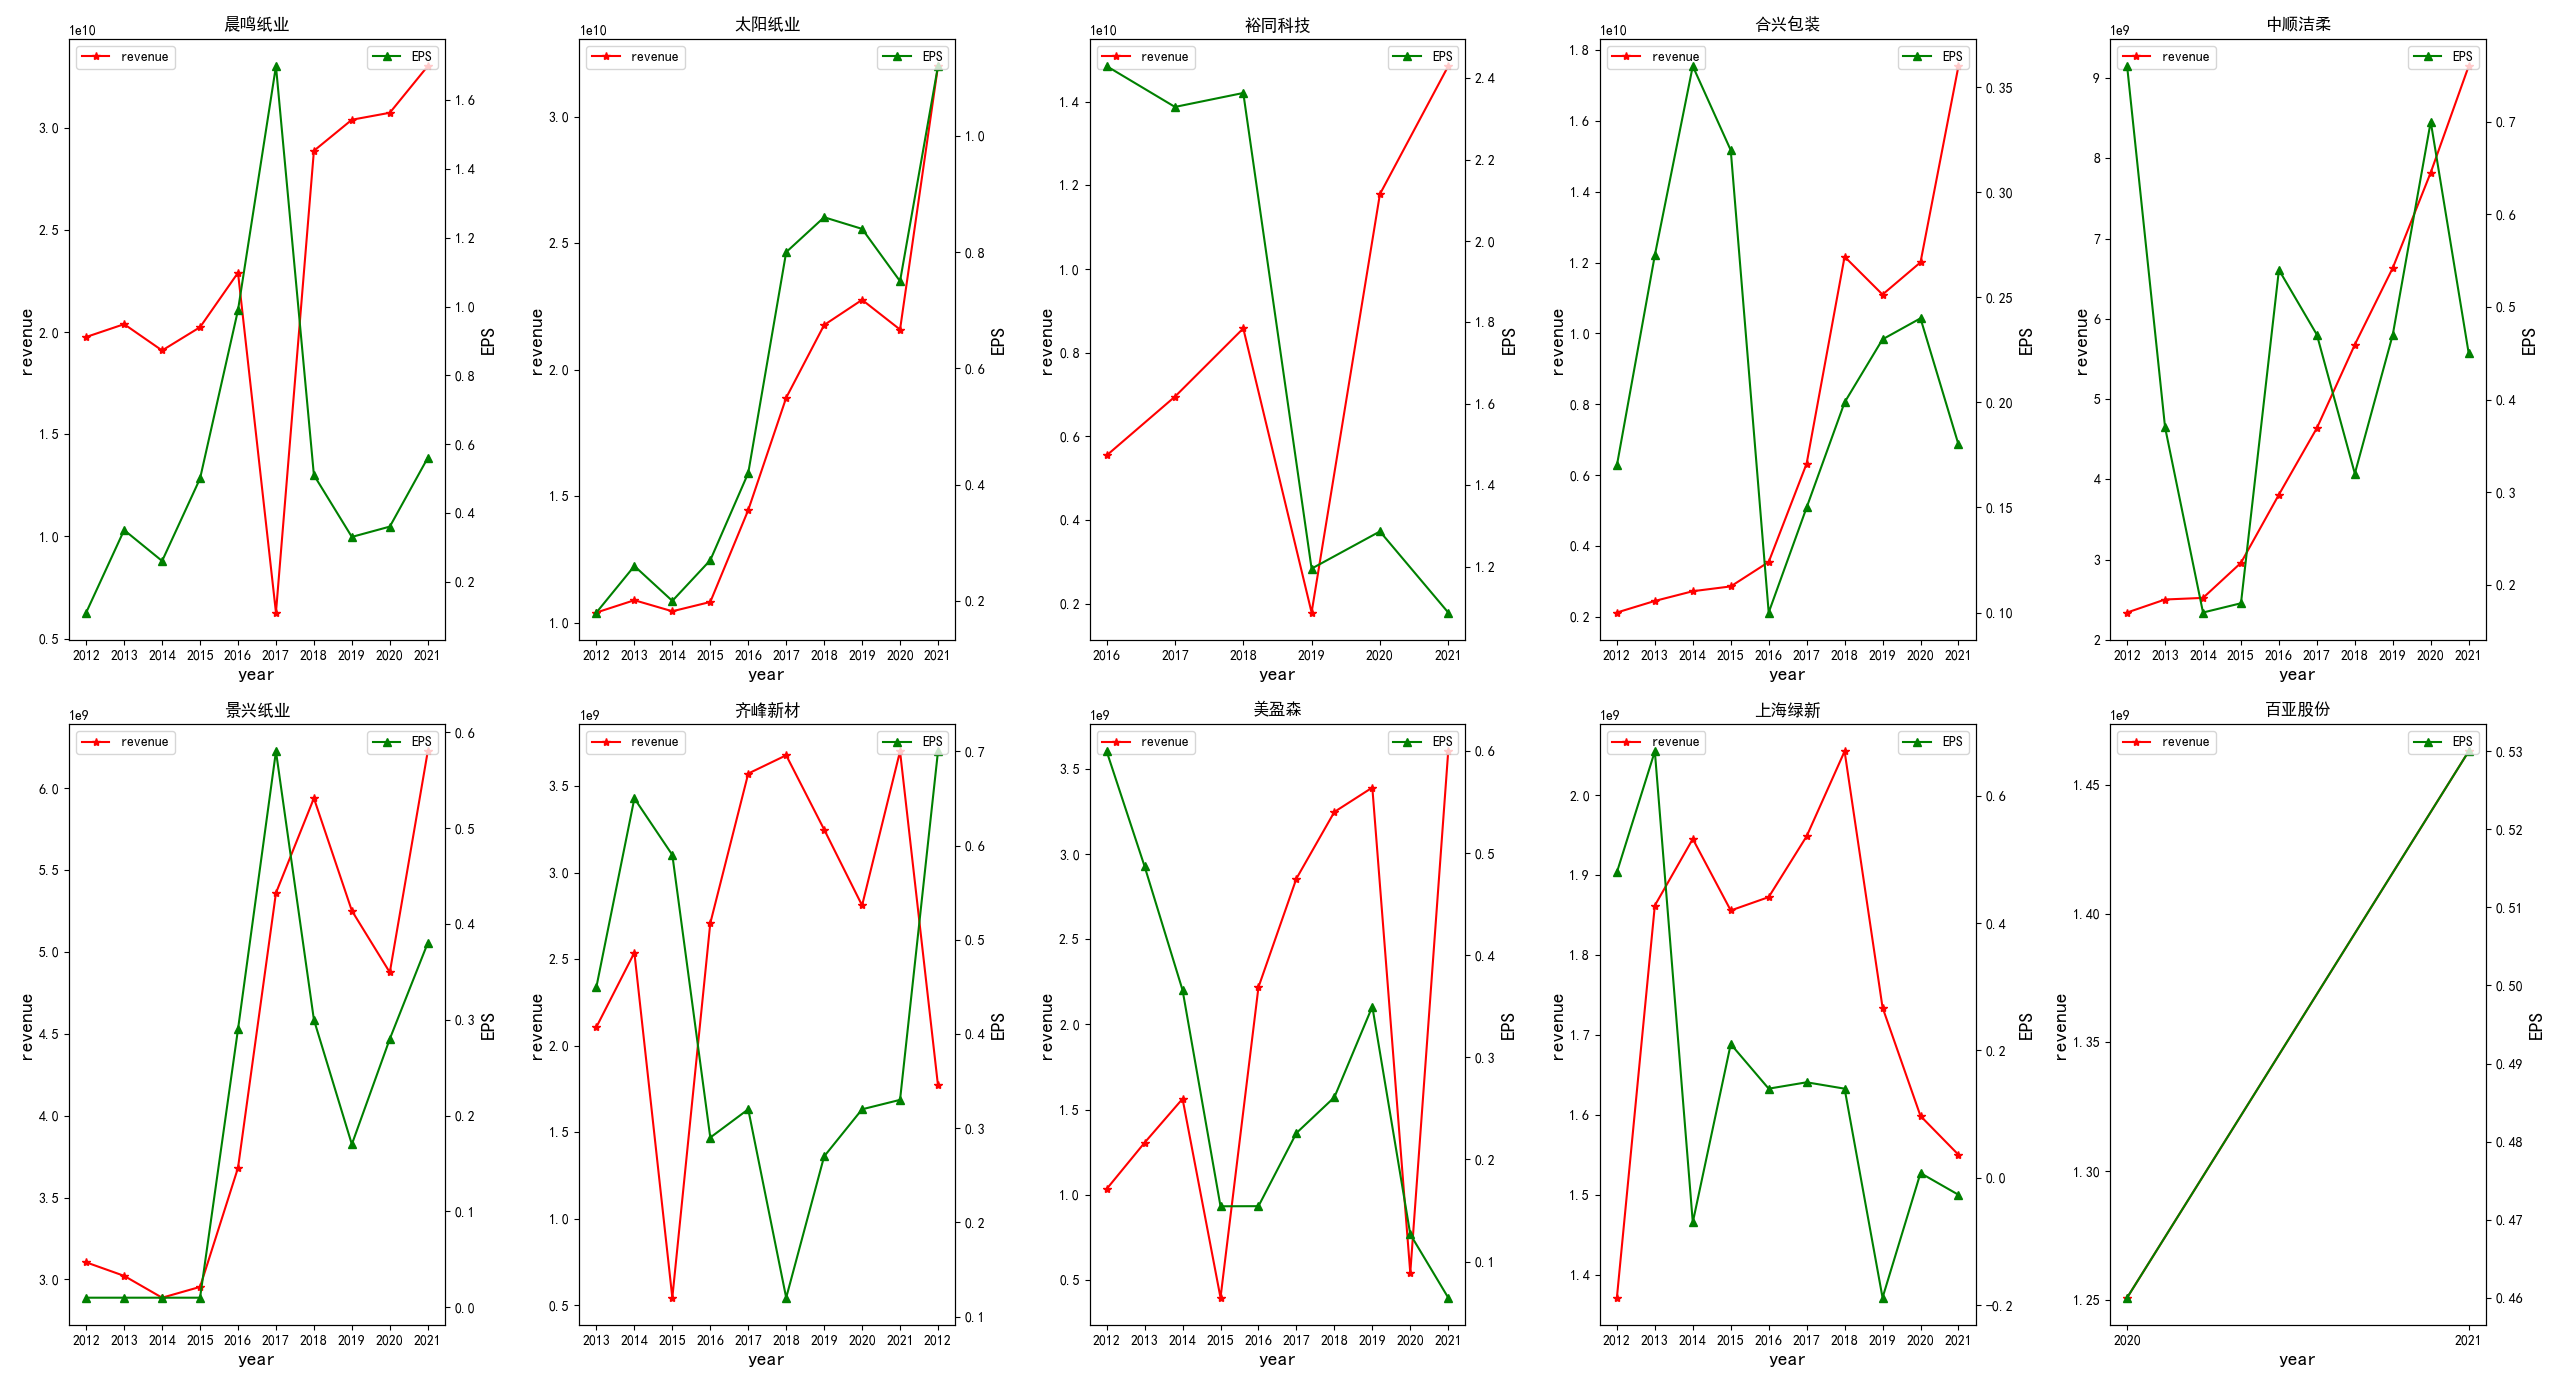
def paint1():
ax = plt.figure(figsize=(12.8 * 2, 7.2 * 2))
for j, i in enumerate(top10):
ax1 = ax.add_subplot(2, 5, j+1)
ax1.plot(i[1]['year'], i[1]['revenue'],c='r',marker="*", label='revenue')
ax1.set_xlabel('year',fontsize=14)
ax1.set_ylabel('revenue',fontsize=14)
ax1.legend(loc='upper left')
ax2 = ax1.twinx()
ax2.plot(i[1]['year'], i[1]['eps'], c='g', marker="^", label='EPS')
ax2.set_ylabel('EPS',fontsize=14)
# plt.xlabel("year")
# plt.ylabel("revunue")
ax2.set_title(i[0])
ax2.legend(loc='upper right')
# ax.legend()
ax.subplots_adjust(top=0.972,
bottom=0.044,
left=0.027,
right=0.971,
hspace=0.14,
wspace=0.358
)
ax.show()
ax.savefig('fig.png')
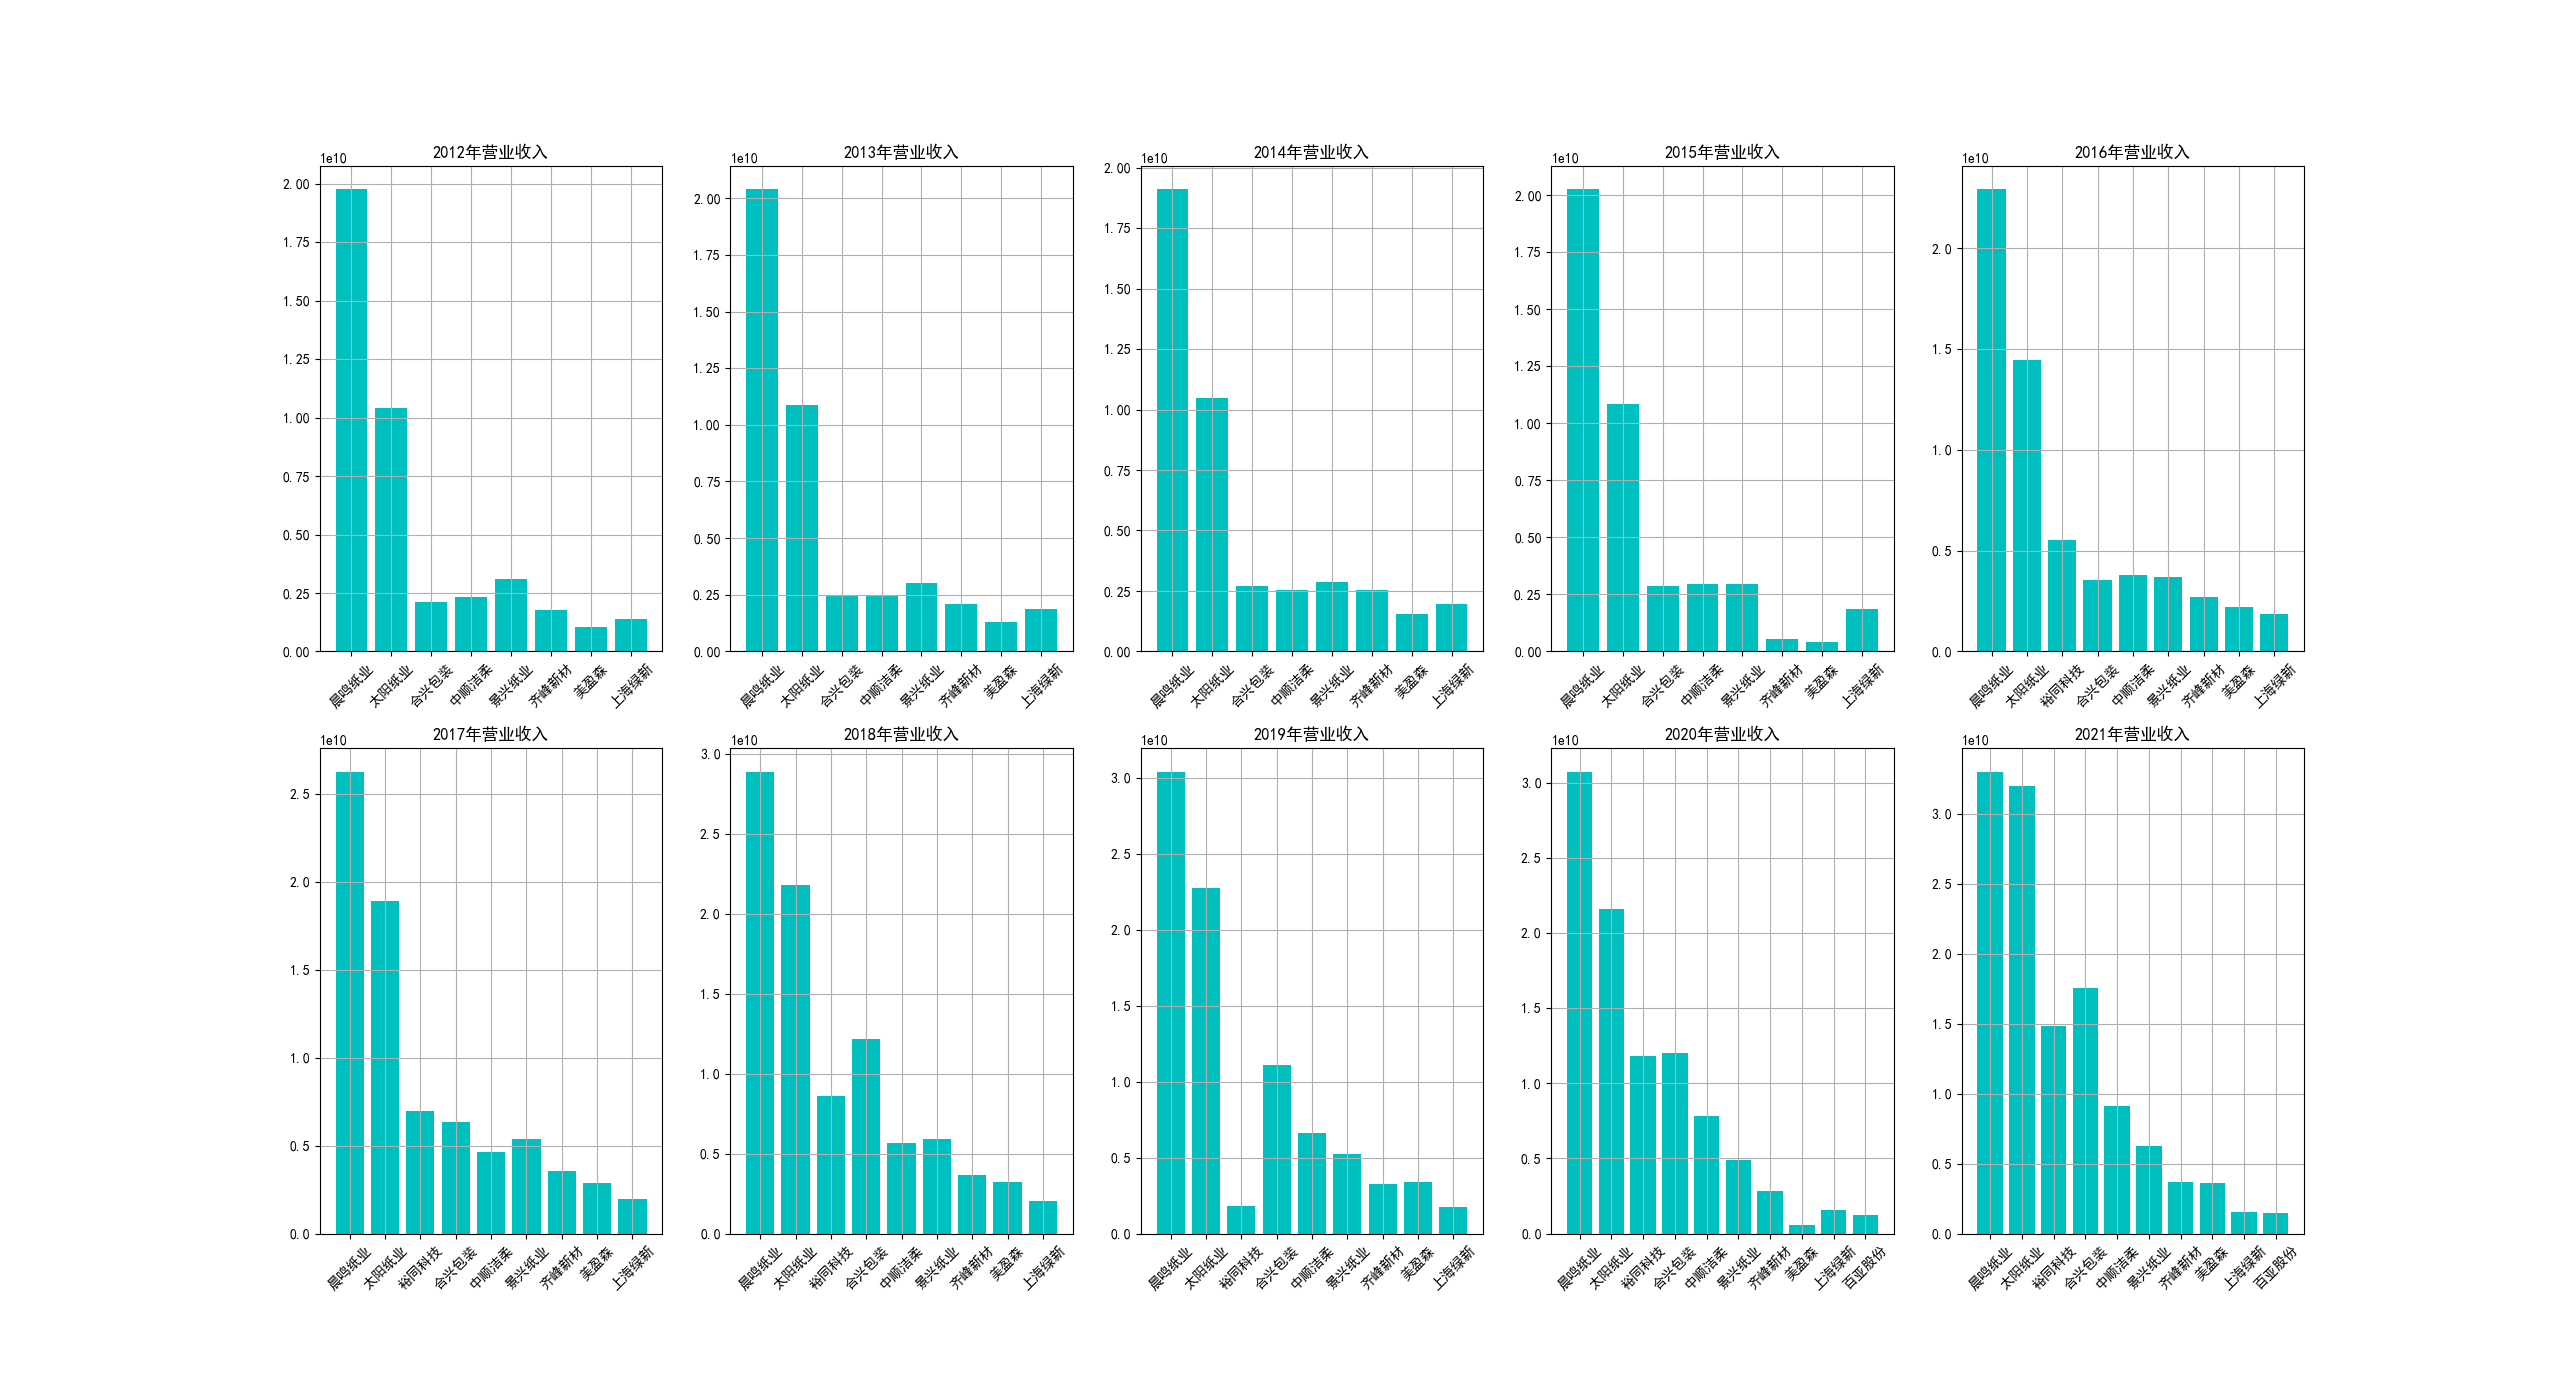
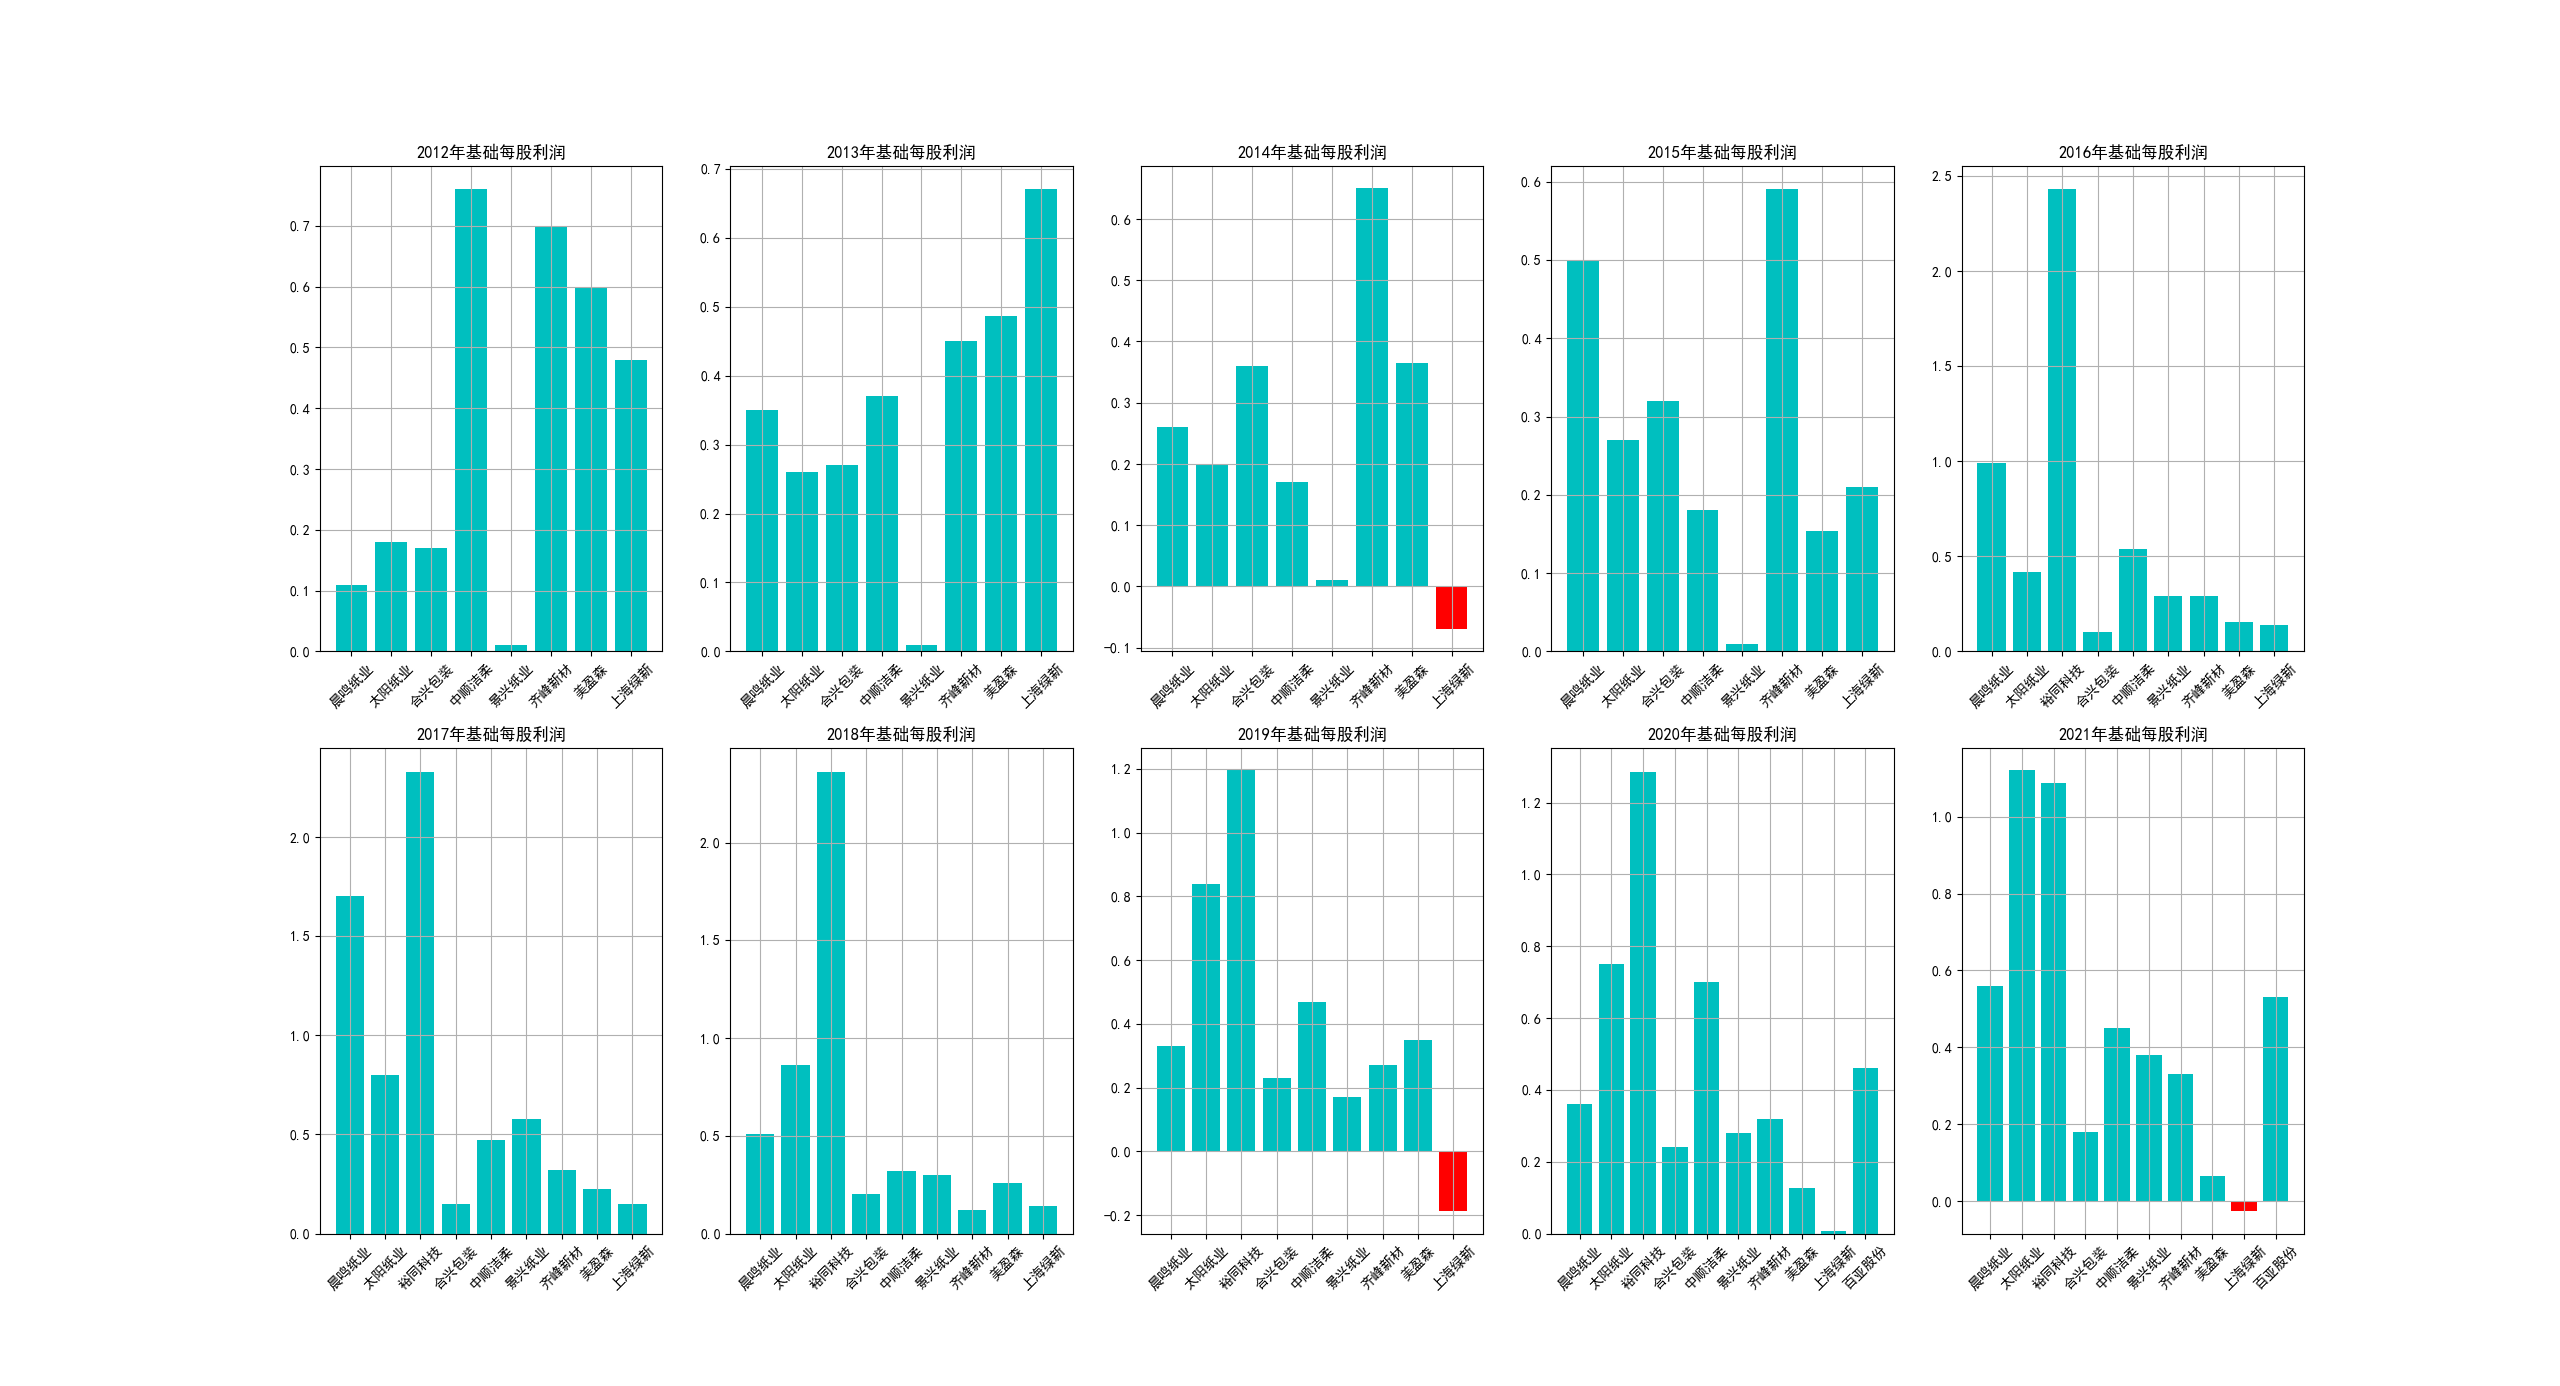
def paint2():
pdata = []
top10 = [i[1] for i in top10]
for i in top10:
for j, obj in enumerate(i['year']):
pdata.append(
{
'name': i['name'],
'year': obj,
'revenue':i['revenue'][j],
'eps':i['eps'][j],
'mean':i['mean']
})
pdata = pd.DataFrame(pdata)
# def paint2():
ax1 = plt.figure(figsize=(12.8*2,7.2*2))
ax2 = plt.figure(figsize=(12.8*2,7.2*2))
for i in range(2012,2022):
year = str(i)
x = pdata.loc[pdata.year==year, 'name']
y = pdata.loc[pdata.year==year, 'revenue']
y2 = pdata.loc[pdata.year==year, 'eps']
y2_r = y2[y2 < 0]
x_r = x[y2 < 0]
ax = ax1.add_subplot(2,5,i-2011)
ax.bar(x,y,color='c')
ax.grid(True)
ax.set_xticklabels(x,rotation=45)
ax.set_title(year+'年营业收入')
ax = ax2.add_subplot(2, 5, i - 2011)
ax.bar(x, y2, color='c')
ax.bar(x_r,y2_r,color='r')
ax.grid(True)
ax.set_xticklabels(x, rotation=45)
ax.set_title(year + '年基础每股利润')
ax1.show()
ax1.savefig('营业收入逐年横向对比.png')
ax2.show()
ax2.savefig('基础每股收益逐年横向对比.png')