import re
import pandas as pd
import os
import time
import json
import requests
from selenium import webdriver
from selenium.webdriver.common.by import By
from selenium.webdriver.common.action_chains import ActionChains
from selenium.webdriver.support import expected_conditions
from selenium.webdriver.support.wait import WebDriverWait
from selenium.webdriver.common.keys import Keys
from selenium.webdriver.support.select import Select
from selenium.webdriver.common.desired_capabilities import DesiredCapabilities
df_sz = pd.DataFrame({'index': ['002069','000798','002696','200992','002086'],
'name': ['獐子岛','中水渔业','百洋股份','中鲁B','ST东洋']
})
df_sh = pd.DataFrame({'index': ['600097','600257','600467'],
'name': ['开创国际','大湖股份','好当家']
})
name_sz = df_sz['name'].tolist()
code_sh = df_sh['index'].tolist()
driver = webdriver.Firefox()
def getszHTML(name): #定义获取深交所公司html的函数
driver.get("http://www.szse.cn/disclosure/listed/fixed/index.html")
driver.maximize_window()
driver.implicitly_wait(3)
driver.find_element(By.ID, "input_code").click()
driver.find_element(By.ID, "input_code").send_keys(name)
driver.find_element(By.ID, "input_code").send_keys(Keys.DOWN)
driver.find_element(By.ID, "input_code").send_keys(Keys.ENTER)
driver.find_element(By.CSS_SELECTOR, "#select_gonggao .c-selectex-btn-text").click()
driver.find_element(By.LINK_TEXT, "年度报告").click()
driver.find_element(By.CSS_SELECTOR, ".input-left").click()
driver.find_element(By.CSS_SELECTOR, "#c-datepicker-menu-1 .calendar-year span").click()
driver.find_element(By.CSS_SELECTOR, ".active li:nth-child(113)").click()
driver.find_element(By.CSS_SELECTOR, "#c-datepicker-menu-1 tr:nth-child(1) > .available:nth-child(3) > .tdcontainer").click()
driver.find_element(By.CSS_SELECTOR, "#c-datepicker-menu-2 tr:nth-child(2) > .weekend:nth-child(1) > .tdcontainer").click()
driver.find_element(By.ID, "query-btn").click()
element = driver.find_element(By.ID, 'disclosure-table')
def getshHTML(code): #定义获取上交所公司html的函数
driver.get("http://www.sse.com.cn/disclosure/listedinfo/regular/")
driver.maximize_window()
driver.implicitly_wait(3)
driver.find_element(By.ID, "inputCode").click()
driver.find_element(By.ID, "inputCode").send_keys(code)
driver.find_element(By.CSS_SELECTOR, ".sse_outerItem:nth-child(4) .filter-option-inner-inner").click()
driver.find_element(By.LINK_TEXT, "年报").click()
def Save(filename,content): #保存文件
name = open(filename+'.html','w',encoding='utf-8')
name.write(content)
name.close()
i=1
for code in code_sh:
getshHTML(code)
time.sleep(1) # 延迟执行1秒
html = driver.find_element(By.CLASS_NAME, 'table-responsive')
innerHTML = html.get_attribute('innerHTML')
Save(code,innerHTML)
print('上交所共有',len(code_sh),'家,已获取第',i,'/',len(code_sh))
i=i+1
i=1
for name in name_sz:
getszHTML(name)
time.sleep(1) # 延迟执行1秒
html = driver.find_element(By.ID, 'disclosure-table')
innerHTML = html.get_attribute('innerHTML')
Save(name,innerHTML)
driver.refresh()
time.sleep(1)
print('深交所共有',len(name_sz),'家,已获取第',i,'/',len(name_sz))
i=i+1
driver.quit()
print('获取完毕')
class DisclosureTable():
'''
解析深交所定期报告页搜索表格
'''
def __init__(self, innerHTML):
self.html = innerHTML
self.prefix = 'https://disc.szse.cn/download'
self.prefix_href = 'https://www.szse.cn/'
#
p_a = re.compile('(.*?)', re.DOTALL)
p_span = re.compile('(.*?)', re.DOTALL)
self.get_code = lambda txt: p_a.search(txt).group(1).strip()
self.get_time = lambda txt: p_span.search(txt).group(1).strip()
#
self.txt_to_df()
def txt_to_df(self):
# html table text to DataFrame
html = self.html
p = re.compile('(.*?) ', re.DOTALL)
trs = p.findall(html)
p2 = re.compile('(.*?)', re.DOTALL)
tds = [p2.findall(tr) for tr in trs[1:]]
df = pd.DataFrame({'证券代码': [td[0] for td in tds],
'简称': [td[1] for td in tds],
'公告标题': [td[2] for td in tds],
'公告时间': [td[3] for td in tds]})
self.df_txt = df
def get_link(self, txt):
p_txt = '(.*?)'
p = re.compile(p_txt, re.DOTALL)
matchObj = p.search(txt)
attachpath = matchObj.group(1).strip()
href = matchObj.group(2).strip()
title = matchObj.group(3).strip()
return([attachpath, href, title])
def get_data(self):
get_code = self.get_code
get_time = self.get_time
get_link = self.get_link
#
df = self.df_txt
codes = [get_code(td) for td in df['证券代码']]
short_names = [get_code(td) for td in df['简称']]
ahts = [get_link(td) for td in df['公告标题']]
times = [get_time(td) for td in df['公告时间']]
#
prefix = self.prefix
prefix_href = self.prefix
df = pd.DataFrame({'证券代码': codes,
'简称': short_names,
'公告标题': [aht[2] for aht in ahts],
'attachpath': [prefix + aht[0] for aht in ahts],
'公告时间': times,
'href': [prefix_href + aht[1] for aht in ahts]
})
self.df_data = df
return(df)
def getshDATA(code): #解析上交所公司html
f = open(code+'.html',encoding='utf-8')
html = f.read()
f.close()
p1 = re.compile('(.*?) (.*?)(.*?)',
re.DOTALL)
href = [p2.search(td).group(1) for td in tds]
titles = [p2.search(td).group(2) for td in tds]
times = [p2.search(td).group(3) for td in tds]
prefix0 = 'http://www.sse.com.cn'
df = pd.DataFrame({'证券代码': codes,
'简称': names[1],
'公告标题': [lf.strip() for lf in titles],
'href': [prefix0 + lf.strip() for lf in href],
'公告时间': [t.strip() for t in times]
})
return(df)
def Readhtml(filename): #读取
with open(filename+'.html', encoding='utf-8') as f:
html = f.read()
return html
def tidy(df): #清除
d = []
for index, row in df.iterrows():
dd = row[2]
n = re.search("摘要|取消|英文", dd)
if n != None:
d.append(index)
df1 = df.drop(d).reset_index(drop = True)
return df1
def filter_links(words,df,include=True):
ls=[]
for word in words:
if include:
ls.append([word in f for f in df.公告标题])
else:
ls.append([word not in f for f in df.公告标题])
index = []
for r in range(len(df)):
flag = not include
for c in range(len(words)):
if include:
flag = flag or ls[c][r]
else:
flag = flag and ls[c][r]
index.append(flag)
df2 = df[index]
return(df2)
def rename(df):
for i in df["简称"]:
i = i.replace("*","")
i = i.replace(" ","")
if i !="-":
sn=i
return sn
def Loadpdf_sh(df):#用于下载文件
d1 = {}
df["公告时间"] = pd.to_datetime(df["公告时间"])
na = rename(df)
for index, row in df.iterrows():
names = na + str(row[4].year-1)+"年年度报告"
d1[names] = row[3]
for key, value in d1.items():
f = requests.get(value)
with open (key + ".pdf", "wb") as ff:
ff.write(f.content)
def Loadpdf(df):#用于下载文件
d1 = {}
for index, row in df.iterrows():
d1[row[2]] = row[3]
for key, value in d1.items():
f = requests.get(value)
with open (key + ".pdf", "wb") as code:
code.write(f.content)
i = 0
for index,row in df_sh.iterrows(): #提取上交所的信息表格
i+=1
code = row[0]
name = row[1]
df = getshDATA(code)
df_all = filter_links(["摘要","营业","并购","承诺","取消","英文"],df,include= False)
df_orig = filter_links(["(","("],df_all,include = False)
df_updt = filter_links(["(","("],df_all,include = True)
df_updt = filter_links(["取消"],df_updt,include = False)
df_all.to_csv(name+'.csv',encoding='utf-8-sig')
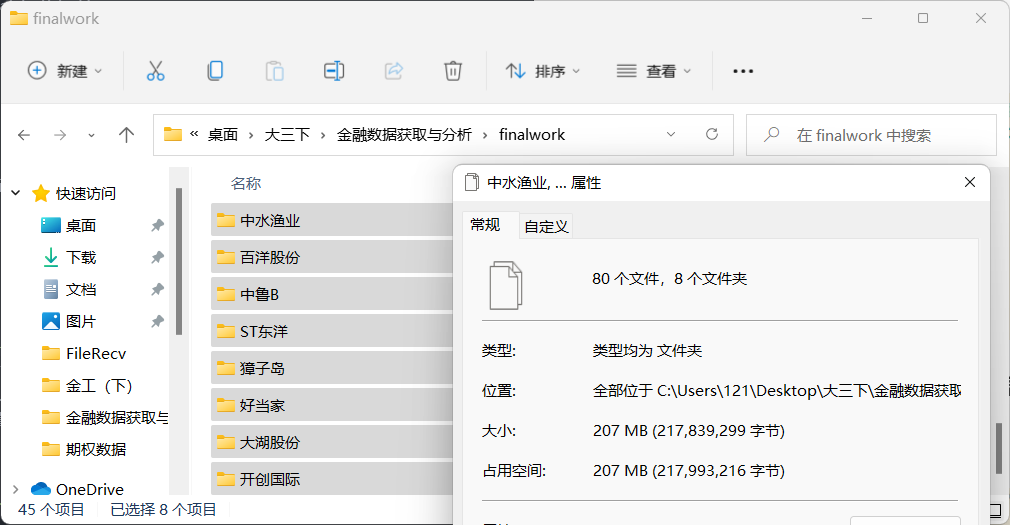
os.makedirs(name,exist_ok=True)#创建用于放置下载文件的子文件夹
os.chdir(name)
Loadpdf_sh(df_all)
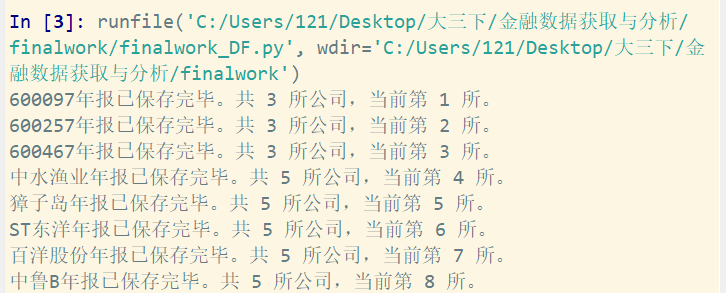
print(code+'年报已保存完毕。共',len(code_sh),'所公司,当前第',i,'所。')
os.chdir('../')
for index,row in df_sz.iterrows(): #提取深交所的信息表格
i+=1
name = row[1].replace('*','')
html = Readhtml(name)
dt = DisclosureTable(html)
df = dt.get_data()
df1 = tidy(df)
df1.to_csv(name+'.csv',encoding='utf-8-sig')
os.makedirs(name,exist_ok=True)
os.chdir(name)
Loadpdf(df1)
print(name+'年报已保存完毕。共',len(name_sz),'所公司,当前第',i,'所。')
os.chdir('../')
import re
import pandas as pd
import fitz
df_company = pd.DataFrame({'index': ['600097','600257','600467'],
'name': ['开创国际','大湖股份','好当家']
})
company = df_company['name'].tolist()
def rename(df):
for i in df["简称"]:
i = i.replace("*","")
i = i.replace(" ","")
if i !="-":
sn=i
return sn
t=0
for com in company:
t+=1
com = com.replace('*','')
df = pd.read_csv(com+'.csv',converters={'证券代码':str})
d1 = {}
na = rename(df)
y = 2021
for index, row in df.iterrows():
names = na + str(y)+"年年度报告"
d1[names] = row[3]
y = y-1
df = df.sort_index(ascending=False)
final = pd.DataFrame(index=range(2012,2022),columns=['营业收入(元)','基本每股收益(元/股)'])
final.index.name='年份'
code = str(df.iloc[0,1])
name = df.iloc[-1,2].replace(' ','')
for i in range(len(df)):
title=list(d1.keys())[i]
doc = fitz.open('./%s/%s.pdf'%(com,title))
text=''
for j in range(15):
page = doc[j]
text += page.get_text()
p_year=re.compile('.*?(\d{4}) .*?年度报告.*?')
year = int(p_year.findall(text)[0])
p_rev = re.compile('(?<=\n)营业总?收入(?\w?)?\s?\n?([\d+,.]*)\s\n?')
p_eps = re.compile('(?<=\n)基本每股收益(元/?/?\n?股)\s?\n?([-\d+,.]*)\s?\n?')
p_site = re.compile('(?<=\n)\w*办公地址:?\s?\n?(.*?)\s?(?=\n)',re.DOTALL)
p_web =re.compile('(?<=\n)公司\w*网址:?\s?\n?([a-zA-Z./:]*)\s?(?=\n)',re.DOTALL)
revenue=float(p_rev.search(text).group(1).replace(',',''))
eps=p_eps.search(text).group(1)
final.loc[year,'营业收入(元)']=revenue
final.loc[year,'基本每股收益(元/股)']=eps
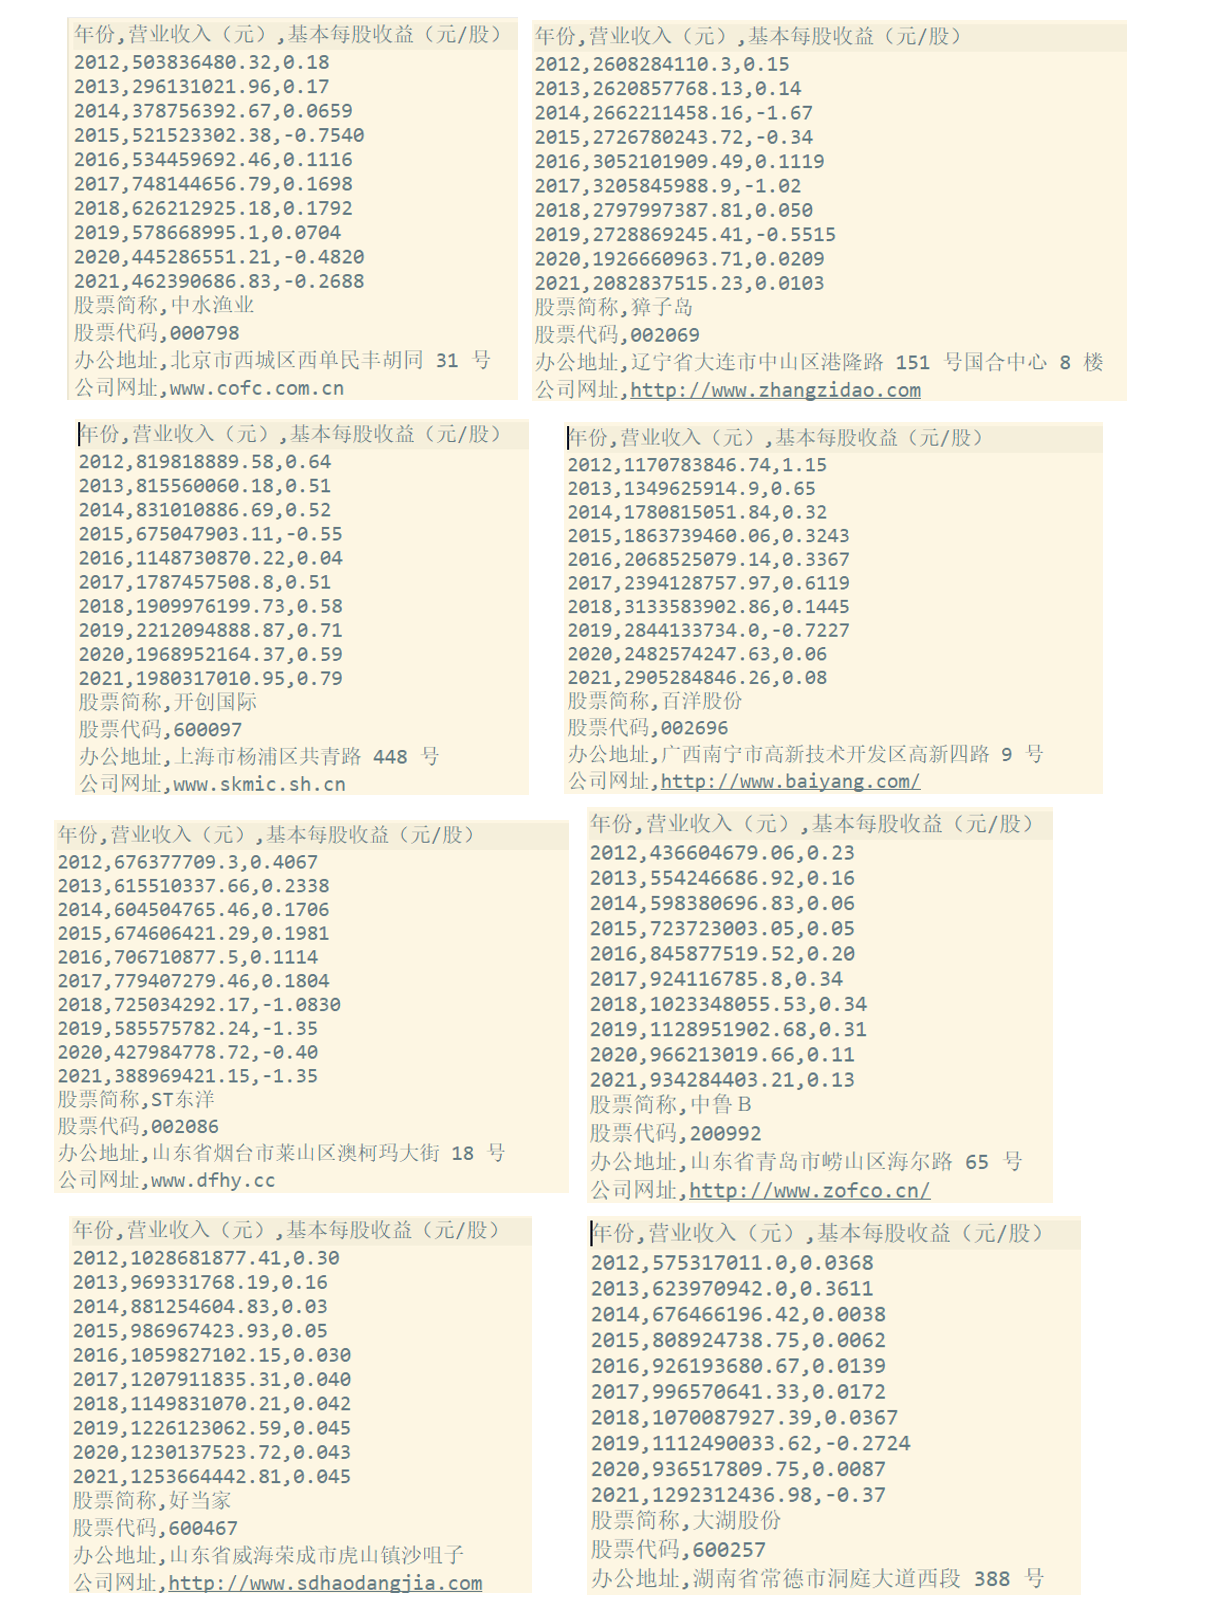
final.to_csv('%s数据.csv' %com,encoding='utf-8-sig')
site=p_site.search(text).group(1)
web=p_web.search(text).group(1)
with open('%s数据.csv'%com,'a',encoding='utf-8-sig') as f:
content='股票简称,%s\n股票代码,%s\n办公地址,%s\n公司网址,%s'%(name,code,site,web)
f.write(content)
print(name+'数据已保存完毕'+'(',t,'/',len(company),')')
      df_company = pd.DataFrame({'index': ['000798','002069','002086','002696','200992'],
                         'name': ['中水渔业','獐子岛','ST东洋','百洋股份','中鲁B']
                         })

      company = df_company['name'].tolist()


      t=0
      for com in company:
         t+=1
         com = com.replace('*','')
         df = pd.read_csv(com+'.csv',converters={'证券代码':str})
         df = df.sort_index(ascending=False)
         final = pd.DataFrame(index=range(2012,2022),columns=['营业收入(元)','基本每股收益(元/股)'])
         final.index.name='年份'
         code = str(df.iloc[0,1])
         name = df.iloc[-1,2].replace(' ','')


         for i in range(len(df)):
              title=df.iloc[i,3]
              doc = fitz.open('./%s/%s.pdf'%(com,title))
              text=''
              for j in range(20):
                  page = doc[j]
                  text += page.get_text()
              p_year=re.compile('.*?(\d{4}) .*?年度报告.*?')
              year = int(p_year.findall(text)[0])
              #设置需要匹配的四种数据的pattern
              p_rev = re.compile('(?<=\n)营业总?收入(?\w?)?\s?\n?([\d+,.]*)\s\n?')
              p_eps = re.compile('(?<=\n)基本每股收益(元/?/?\n?股)\s?\n?([-\d+,.]*)\s?\n?')
              p_site = re.compile('(?<=\n)\w*办公地址:?\s?\n?(.*?)\s?(?=\n)',re.DOTALL)
              p_web =re.compile('(?<=\n)公司\w*网址:?\s?\n?([a-zA-Z./:]*)\s?(?=\n)',re.DOTALL)

              revenue=float(p_rev.search(text).group(1).replace(',',''))

              eps=p_eps.search(text).group(1)
              final.loc[year,'营业收入(元)']=revenue
              final.loc[year,'基本每股收益(元/股)']=eps

         final.to_csv('%s数据.csv' %com,encoding='utf-8-sig')


         site=p_site.search(text).group(1)
         web=p_web.search(text).group(1)


         with open('%s数据.csv'%com,'a',encoding='utf-8-sig') as f:
             content='股票简称,%s\n股票代码,%s\n办公地址,%s\n公司网址,%s'%(name,code,site,web)
             f.write(content)
         print(name+'数据已保存完毕'+'(',t,'/',len(company),')')
import pandas as pd
import matplotlib.pyplot as plt
df_company = pd.DataFrame({'index': ['002069','000798','002696','200992','002086',
                                '600097','600257','600467'],
                      'name': ['獐子岛','中水渔业','百洋股份','中鲁B','ST东洋',
                               '开创国际','大湖股份','好当家']
                      })


company = df_company['name'].tolist()
dflist=[]
for name in company:
    com = name.replace('*','')
    data=pd.read_csv(com+'数据.csv')
    dflist.append(data)

comps = len(dflist)
for i in range(comps):
    dflist[i]=dflist[i].set_index('年份')

def rev(data):
    df=pd.DataFrame(columns=['近十年总营业收入(元)'])
    for i in range(comps):
        df.loc[dflist[i].loc['股票简称','营业收入(元)'],'近十年总营业收入(元)']=dflist[i].iloc[:10,0].astype(float).sum()
    return df
rank=rev(dflist).sort_values('近十年总营业收入(元)',ascending=False)


names=['獐子岛','中水渔业','百洋股份','中鲁B','ST东洋','开创国际','大湖股份','好当家']


indexes=[]
for idx in names:
    indexes.append(company.index(idx))


datalist=[]
datalist1=[]
for i in indexes: #在dflist里选出所需公司的营业收入数据
        datalist.append(pd.DataFrame(dflist[i].iloc[:10,0]))
for df in datalist:
    df.index=df.index.astype(int)
    df['营业收入(元)']=df['营业收入(元)'].astype(float)/100000000
for i in indexes: #在dflist里选出所需公司的每股收益数据
        datalist1.append(pd.DataFrame(dflist[i].iloc[:10,1]))
for df in datalist1:
    df.index=df.index.astype(int)
    df['基本每股收益(元/股)']=df['基本每股收益(元/股)'].astype(float)


hori_rev=pd.concat(datalist,axis=1) #将所有公司的df合并成汇总表
hori_eps=pd.concat(datalist1,axis=1)
hori_rev.columns=rank.index
hori_eps.columns=rank.index


# #绘制对比图

plt.rcParams['font.sans-serif']=['SimHei']
plt.figure(figsize=(16,30))
x = datalist[0].index

y_1 = hori_rev.iloc[:,0]
y_2 = hori_rev.iloc[:,1]
y_3 = hori_rev.iloc[:,2]
y_4 = hori_rev.iloc[:,3]
y_5 = hori_rev.iloc[:,4]
y_6 = hori_rev.iloc[:,5]
y_7 = hori_rev.iloc[:,6]
y_8 = hori_rev.iloc[:,7]
plt.xlim(2011,2022,1)
#plt.ylim()
plt.xticks(range(2011,2022),fontsize=18)
plt.yticks(fontsize=18)

plt.plot(x, y_1, color='r', marker='^',markersize=10, linestyle='-', label=hori_rev.columns[0],linewidth = 2.5,alpha=0.8)
plt.plot(x, y_2, color='orange', marker='^', markersize=10,linestyle='-', label=hori_rev.columns[1],linewidth = 2.5,alpha=0.8)
plt.plot(x, y_3, color='yellow', marker='^', markersize=10,linestyle='-', label=hori_rev.columns[2],linewidth = 2.5,alpha=0.8)
plt.plot(x, y_4, color='greenyellow', marker=9, markersize=9,linestyle='-', label=hori_rev.columns[3],linewidth = 2,alpha=0.8)
plt.plot(x, y_5, color='paleturquoise', marker=9,markersize=9, linestyle='-', label=hori_rev.columns[4],linewidth = 2,alpha=0.8)
plt.plot(x, y_6, color='lightskyblue', marker=9, markersize=9,linestyle='-', label=hori_rev.columns[5],linewidth =2,alpha=0.8)
plt.plot(x, y_7, color='lightpink', marker='D', markersize=7,linestyle='-', label=hori_rev.columns[6],linewidth =1.5,alpha=0.8)
plt.plot(x, y_8, color='orchid', marker='s', markersize=7,linestyle='-', label=hori_rev.columns[7],linewidth =1.5,alpha=0.8)

plt.legend(loc = "upper left",prop={'family':'simsun', 'size': 20})  # 显示图例
plt.grid(True)
title="营业收入随时间变化趋势图(2012-2021)"
plt.title(title,fontsize=25)


plt.ylabel("营业收入(亿元)",fontsize=22)  # 设置Y轴标签
plt.xlabel("年份",fontsize=22,loc='left')  # 设置X轴标签

plt.savefig("rev1")#保存图片
plt.show()


plt.rcParams['font.sans-serif']=['SimHei']
plt.rcParams['axes.unicode_minus']=False
plt.figure(figsize=(18,24))
x = datalist[0].index
#y = range(len(names_y))

y_1 = hori_eps.iloc[:,0]
y_2 = hori_eps.iloc[:,1]
y_3 = hori_eps.iloc[:,2]
y_4 = hori_eps.iloc[:,3]
y_5 = hori_eps.iloc[:,4]
y_6 = hori_eps.iloc[:,5]
y_7 = hori_eps.iloc[:,6]
y_8 = hori_eps.iloc[:,7]
plt.xlim(2011,2022,1)
#plt.ylim()
plt.xticks(range(2012,2022),fontsize=18)
plt.yticks(fontsize=18)

plt.plot(x, y_1, color='r', marker='^',markersize=9, linestyle='-', label=hori_eps.columns[0],linewidth = 2,alpha=0.8)
plt.plot(x, y_2, color='orange', marker='^', markersize=9,linestyle='-', label=hori_eps.columns[1],linewidth = 2,alpha=0.8)
plt.plot(x, y_3, color='yellow', marker='^', markersize=9,linestyle='-', label=hori_eps.columns[2],linewidth = 2,alpha=0.8)
plt.plot(x, y_4, color='greenyellow', marker=9, markersize=9,linestyle='-', label=hori_eps.columns[3],linewidth = 2,alpha=0.8)
plt.plot(x, y_5, color='paleturquoise', marker=9,markersize=9, linestyle='-', label=hori_eps.columns[4],linewidth = 2,alpha=0.8)
plt.plot(x, y_6, color='lightskyblue', marker=9, markersize=9,linestyle='-', label=hori_eps.columns[5],linewidth =2,alpha=0.8)
plt.plot(x, y_7, color='lightpink', marker='D', markersize=9,linestyle='-', label=hori_eps.columns[6],linewidth =2,alpha=0.8)
plt.plot(x, y_8, color='orchid', marker='s', markersize=9,linestyle='-', label=hori_eps.columns[7],linewidth =2,alpha=0.8)


plt.legend(loc = "upper left",prop={'family':'simsun', 'size': 20},framealpha=0.8)  # 显示图例
plt.grid(True)
title="基本每股收益随时间变化趋势图(2011-2021)"
plt.title(title,fontsize=25)
plt.ylabel("基本每股收益(元/股)",fontsize=22)  # 设置Y轴标签
plt.xlabel("年份",fontsize=22)  # 设置X轴标签

plt.savefig("eps")#保存图片
plt.show()


hori_revup=hori_rev.head(5)
hori_revdown=hori_rev.tail(5)

hori_epsup=hori_eps.head(5)
hori_epsdown=hori_eps.tail(5)

plt.rcParams['font.sans-serif']=['SimHei']
plt.rcParams['axes.unicode_minus']=False

ax1=hori_revup.plot(kind='bar',color=['r','orange','yellow','greenyellow',
                                      'paleturquoise','lightskyblue','lightpink','orchid']
                    ,figsize=(24,8),fontsize=18,alpha=0.7,grid=True)
ax1.legend(loc='best',prop={'family':'simsun', 'size': 14},framealpha=0.5)
ax1.set_xlabel('年份',loc='left',fontsize=18)
ax1.set_ylabel('营业收入(亿元)',fontsize=18)
ax1.set_title('行业内横向对比营业收入(2012-2016)',fontsize=20)
ax1.figure.savefig('1')

ax2=hori_revdown.plot(kind='bar',color=['r','orange','yellow','greenyellow',
                                      'paleturquoise','lightskyblue','lightpink','orchid'],
                      figsize=(16 ,8),fontsize=18,alpha=0.7,grid=True)
ax2.legend(loc='best',prop={'family':'simsun', 'size': 14},framealpha=0.5)
ax2.set_xlabel('年份',loc='left',fontsize=18)
ax2.set_ylabel('营业收入(亿元)',fontsize=18)
ax2.set_title('行业内横向对比营业收入(2017-2021)',fontsize=20)
ax2.figure.savefig('2')


ax1=hori_epsup.plot(kind='bar',color=['r','orange','yellow','greenyellow',
                                      'paleturquoise','lightskyblue','lightpink','orchid']
                    ,figsize=(18,10),fontsize=18,grid=True,alpha=0.7)
ax1.legend(loc='best',prop={'family':'simsun', 'size': 14},framealpha=0.7)
ax1.set_xlabel('年份',loc='right',fontsize=18)
ax1.set_ylabel('基本每股收益(元/股)',fontsize=18)
ax1.set_title('行业内横向对比基本每股收益(2012-2016)',fontsize=20)
ax1.figure.savefig('3')

ax2=hori_epsdown.plot(kind='bar',color=['r','orange','yellow','greenyellow',
                                      'paleturquoise','lightskyblue','lightpink','orchid'],
                      figsize=(18,10),fontsize=18,grid=True,alpha=0.7)
ax2.set_xlabel('年份',loc='right',fontsize=18)
ax2.set_ylabel('基本每股收益(元/股)',fontsize=18)
ax2.set_title('行业内横向对比基本每股收益(2017-2021)',fontsize=20)
ax2.figure.savefig('4')
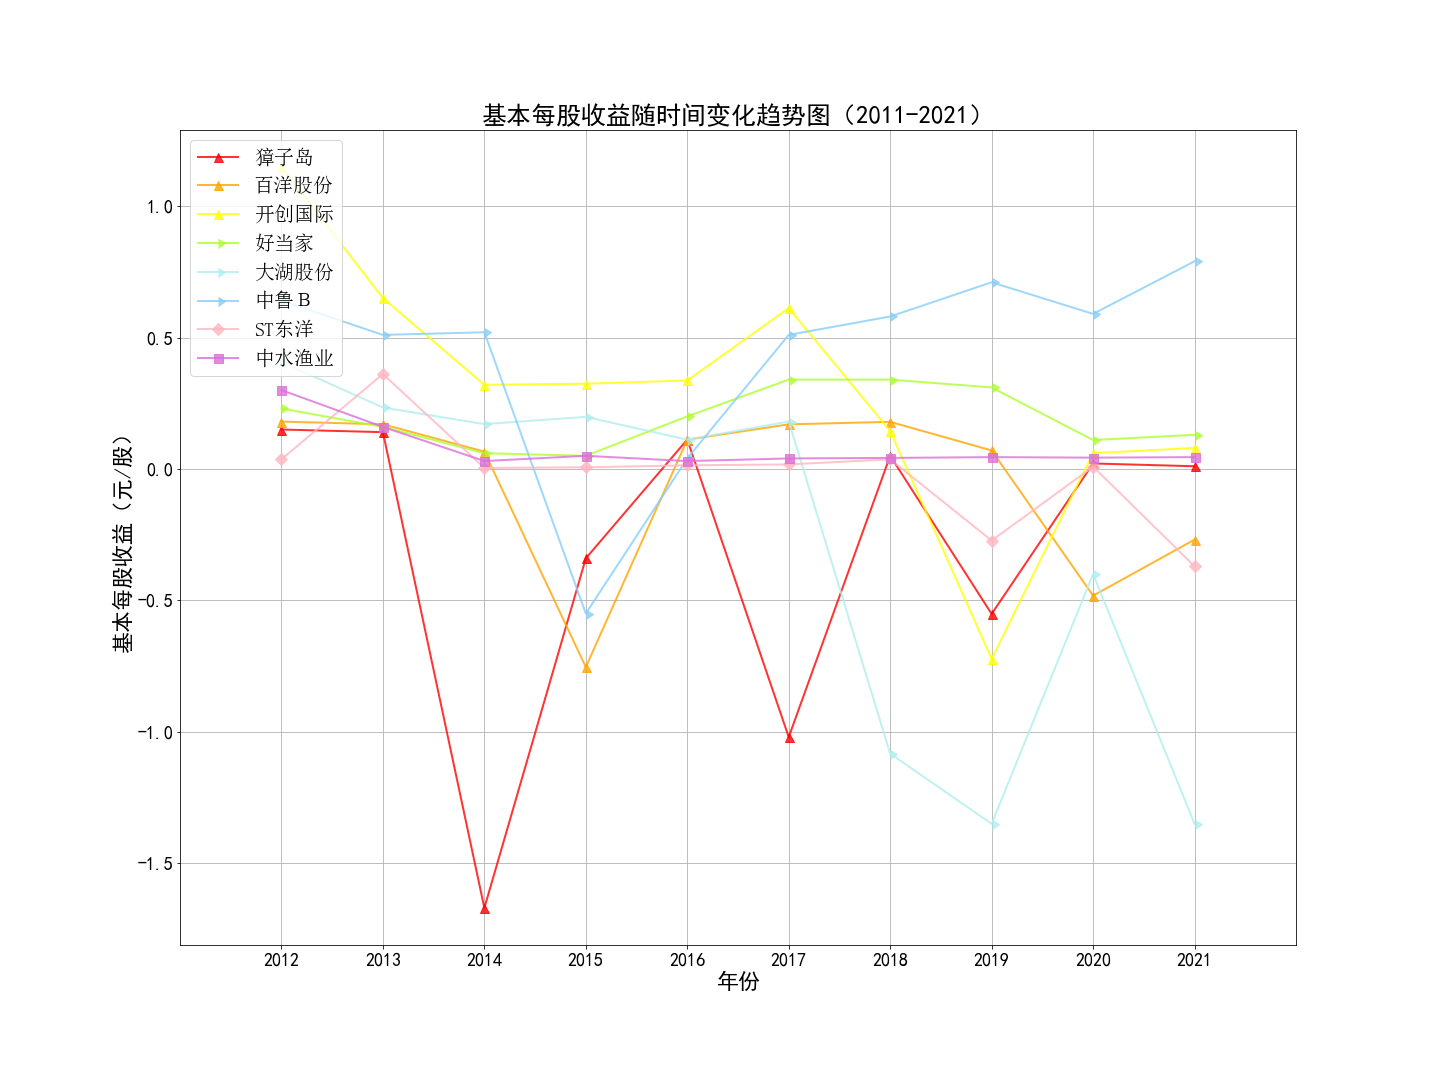
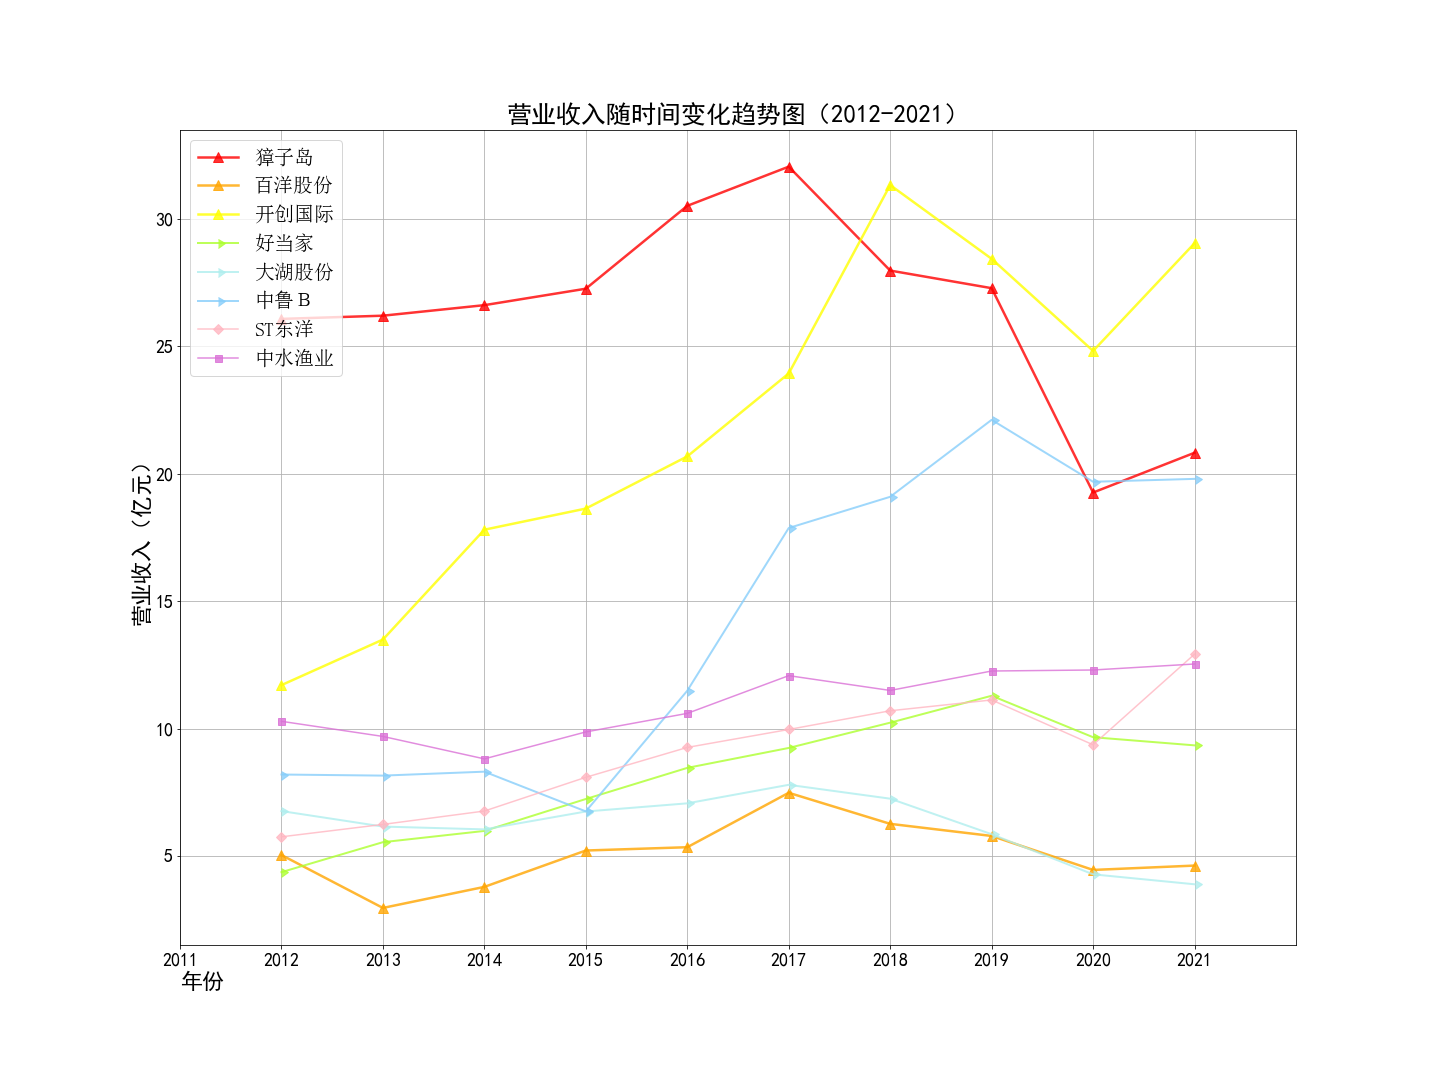
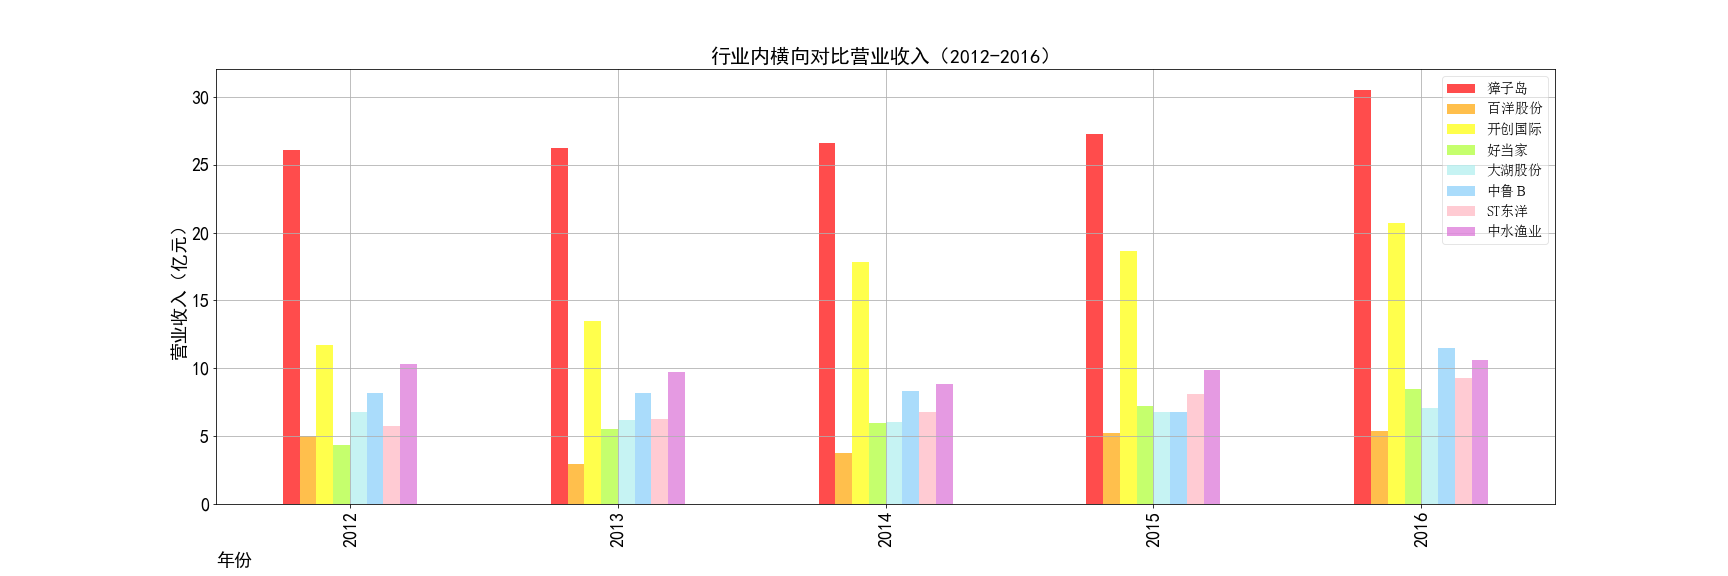
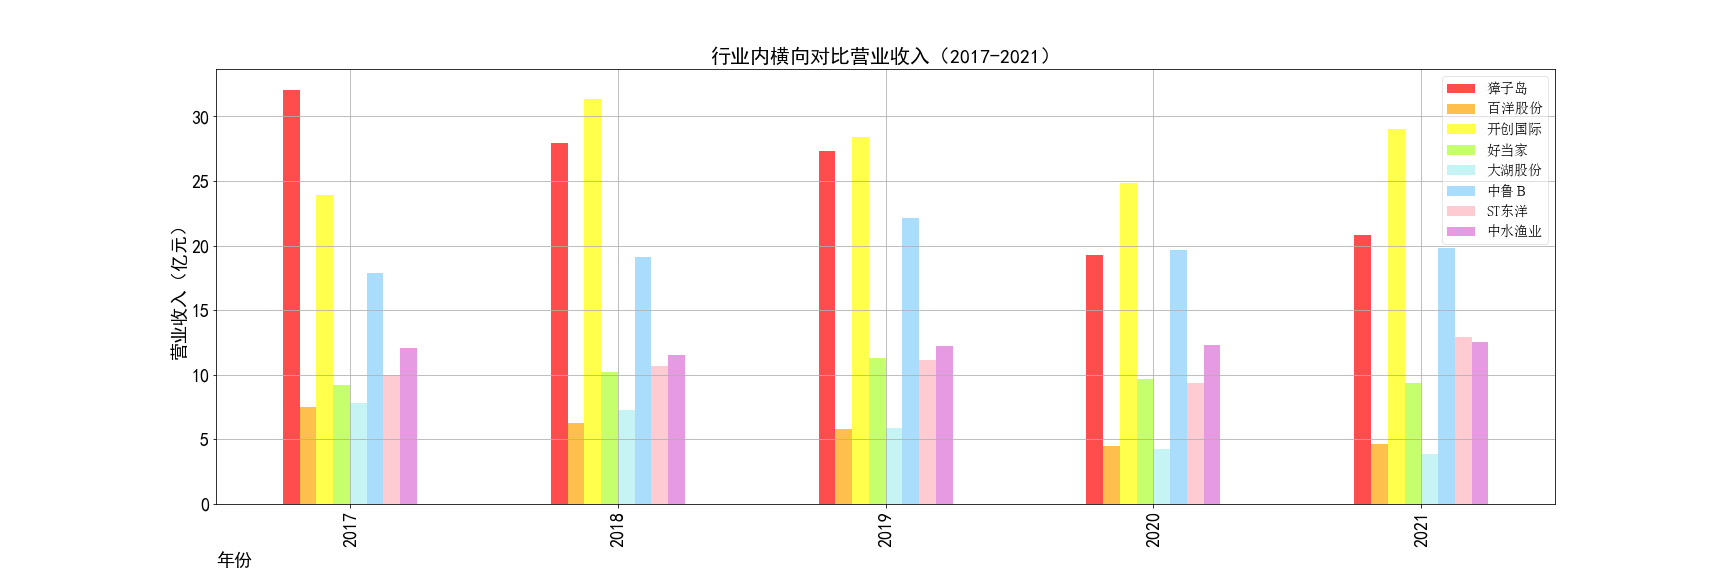
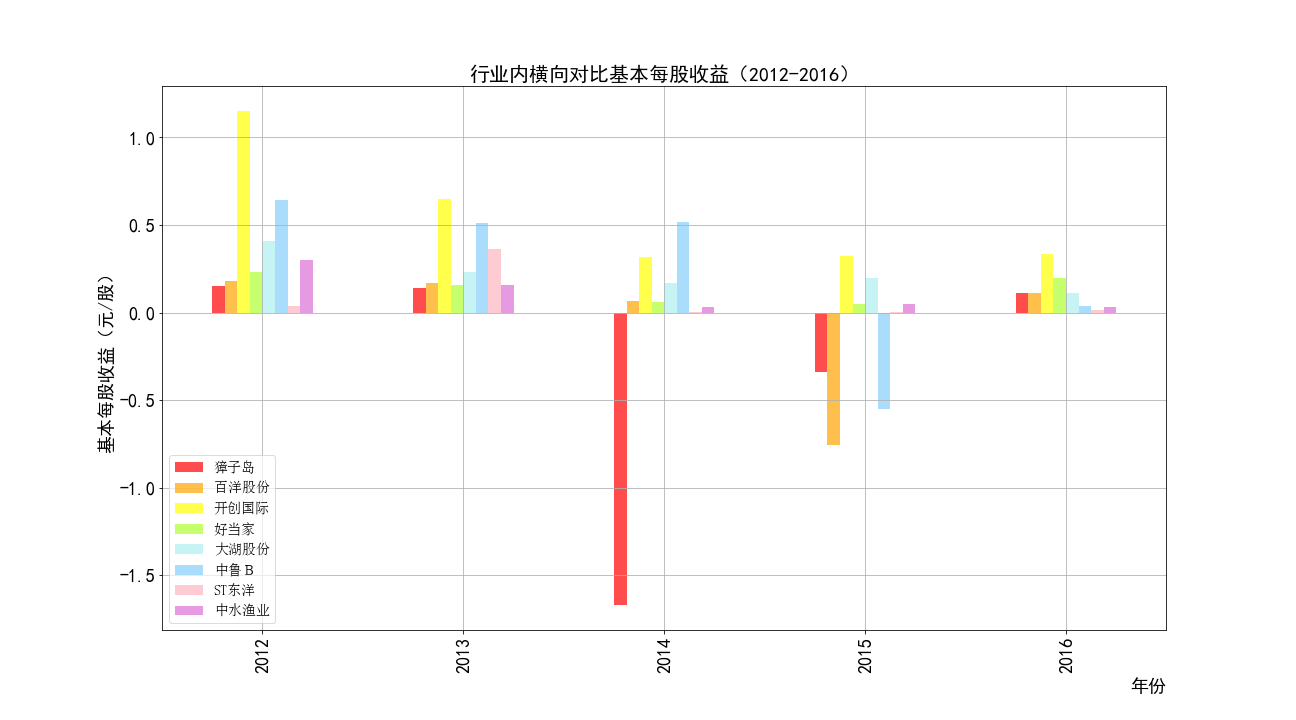
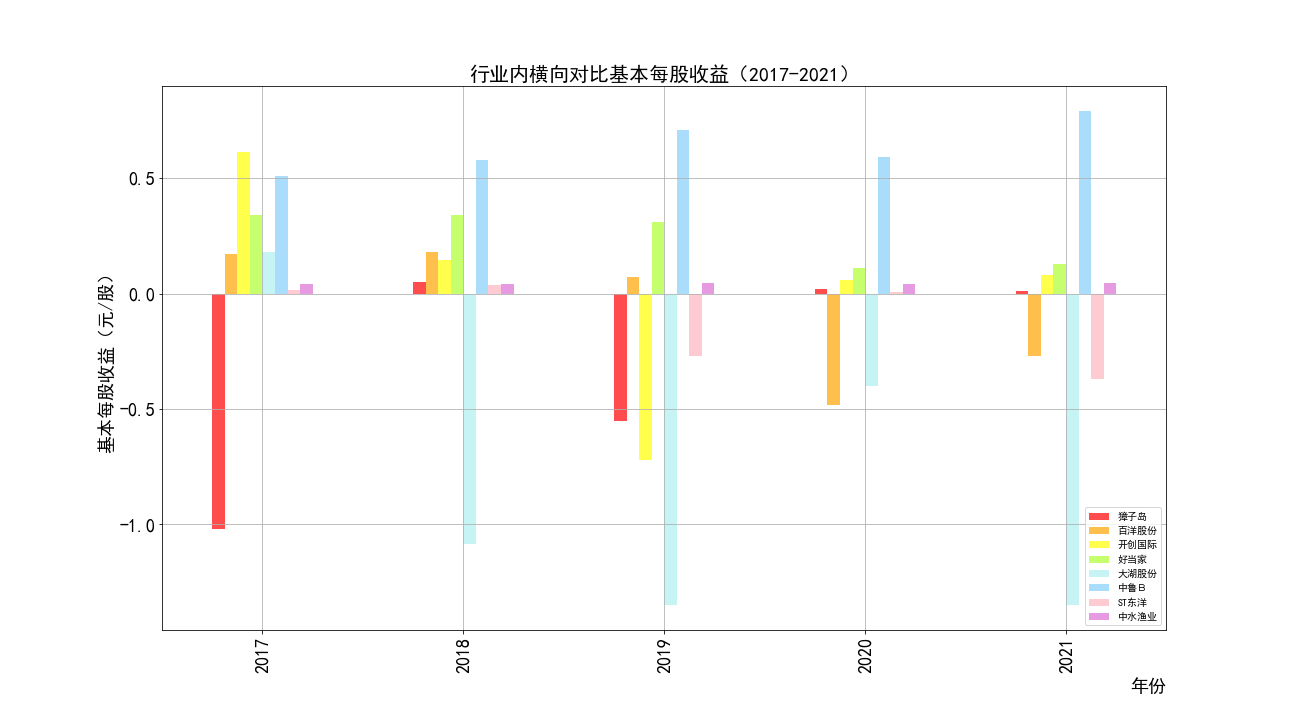
从营业收入的变化趋势对比中可以发现獐子岛、开创国际、中鲁B这三家公司的收入变化幅度较大, 其中獐子岛在2018年前一直为行业龙头,营业收入为排行第二的开创国际的两倍之多, 随后的几年也在稳步上升,而在2018年时收入大幅下降,后续几年的经营表现也不佳, 而开创国际和中鲁B的收入在2015年后都呈现上升的走势,在2018年开创国际超越獐子岛成为行业龙头, 獐子岛则与中鲁B跻身于收入的第二梯度。其余的五家公司营业收入则相对更为平稳, 好当家、中水渔业、ST东洋处于第三梯度,整体呈现稳步上升的趋势,百洋股份和大湖股份处于第四梯队, 整体呈现围绕5亿元收入波动的趋势。 从每股收益的变化趋势来看,开创国际在2012年每股收益排位第一,随后几年都呈现下降的趋势, 此外,除了好当家一直保持在0-0.5元每股的收益,中鲁B出现过一次每股收益为负的情况, 其他几家公司都时常出现负收益的情况,獐子岛的每股收益在2012-2021年间有一半时间为负, 每股收益表现同样不佳的还有大湖股份,近几年的每股收益都为负数。 结合以上数据分析可见渔业这一行业整体的发展情况在2012-2021年间都比较平淡,整体没有表现出 欣欣向荣的未来发展趋势,尤其在近几年的疫情之下都受到了一定程度的冲击,相对表现好一点的 只有开创国际、中鲁B两家公司。
本次作业的完成历时半个多月,应该是大学目前为止花时间精力都最多的一项工作了, 一开始在看到作业要求时根本不知道从何下手,尤其是看到去年的同学的报告界面更是吓得目瞪口呆, 但是船到桥头自然直,发现问题就解决问题,在刚开始动手去做时便发现了这些过程可以细化成几个步骤, 一个步骤一个步骤来思路就会清晰很多,从一开始的爬取网页、获取年报,到后面的解析年报并绘图, 其实做下来就会发现基本上都是老师教过和曾经学过的,听课时会觉得能跟上思路,但是动起手来则艰难得多, 不过虽然每一步都很艰难,但在老师和同学的帮助下,最后还是能完成的,在此也要非常非常感谢老师 以及给我提供过帮助的同学!! (没有她们我真的不行😭😭) 当然,完成作业固然重要,更为重要的是真正理解并掌握这些知识,这次作业中运用到的技巧和代码们实用性很高, 也相信未来能有机会再把它发挥出来,为我所用✌。